
📑 Table of Contents
- What Should Amazon Sellers Look for in an Analytics Tool?
- Quick Comparison: 10 Amazon Analytics Tools at a Glance
- How Does Each Amazon Analytics Tool Compare? (Individual Reviews)
- How Much Do Amazon Analytics Tools Actually Cost? (Pricing Breakdown)
- How Do You Choose the Right Amazon Analytics Tool for Your Business?
- Frequently Asked Questions About Amazon Analytics Tools
- Conclusion
Nearly 73% of Amazon sellers still rely on incomplete profit tracking, effectively costing them margins they never see disappearing until the fiscal year closes. For a seller operating on the razor-thin edges of the 2026 marketplace, this statistical reality is not just an accounting error; it is a silent leak draining potential growth capital. Imagine a seller celebrating a record-breaking revenue month, only to discover weeks later that after accounting for the latest FBA fulfillment fee adjustments, storage surcharges, and advertising costs, their true net margin was 40% lower than their dashboard estimated.
With over 9.7 million sellers now operating on Amazon globally and margin compression accelerating due to rising logistics costs and advertising saturation, flying blind on analytics is no longer a minor inconvenience; it is an existential risk. The era of “revenue is vanity” has never been more accurate. As FBA fees continue to evolve in complexity throughout 2025 and 2026, the ability to track per-unit profitability with forensic accuracy has become the dividing line between brands that scale and those that stagnate.
This guide provides a comprehensive comparison of the 10 best Amazon analytics platforms available in 2026. (For a broader look at the ecosystem, see the guide to the best Amazon seller tools). It evaluates them across the metrics that actually impact the bottom line: pricing transparency, Profit and Loss (P&L) accuracy down to the cent, data refresh speeds, and marketplace coverage. The goal is to help sellers stop paying for bloated software suites containing features they never use and start tracking the financial metrics that dictate business health.
Unlike most comparison articles written by the analytics tools themselves, this guide approaches the landscape from a listing optimization perspective. Analytics provide the diagnosis, telling a seller what is happening with their numbers, but they do not provide the cure. The most accurate P&L dashboard in the world cannot fix a listing that fails to convert traffic. This review also considers how well these tools integrate with the qualitative side of Amazon selling, because analytics only yield ROI when the underlying listings actually convert.
What Should Amazon Sellers Look for in an Analytics Tool?
The best Amazon analytics tools deliver SKU-level profitability tracking, accurate fee attribution across all Amazon charge types, and data refresh rates fast enough to catch problems early.
Evaluating analytics software requires looking beyond the dashboard interface and understanding the data architecture underneath. The primary differentiator between a basic tracker and a professional financial tool is P&L Accuracy. Does the platform track absolutely every one of the 200+ fee types Amazon currently charges? Many simplified tools account for referral and basic fulfillment fees but miss the nuances of long-term storage fees, removal order costs, inbound placement service fees, and ad-hoc adjustments. For a high-volume seller, missing 10-30% of these “hidden” fees results in a Profit and Loss statement that is functionally fiction. True profit is what remains after every cent Amazon deducts is accounted for.
Data Refresh Speed is the second critical factor. In the fast-paced environment of 2026, a 24-hour data delay is unacceptable for serious brands. If a repricing error or a PPC campaign glitch occurs at noon, a seller relying on daily updates might not see the profit hemorrhage until the next morning. Platforms offering 30-minute or near real-time synchronization allow for immediate corrective action. For sellers moving hundreds of units a day, the difference between real-time data and a daily dump can be measured in thousands of dollars of lost margin.
Marketplace Coverage becomes essential as brands expand globally. While some tools support the full spectrum of 21+ Amazon marketplaces, others are limited to North America and Europe. A seller planning to expand into Japan, Australia, or the emerging Latin American markets needs a tool that can consolidate these disparate currencies and fee structures into a unified financial view without requiring manual spreadsheets.
Finally, Integration Depth determines whether a tool streamlines a workflow or complicates it. Does the analytics platform integrate effectively with PPC data, inventory management, and reimbursement recovery? However, caution is advised: more is not always better. The trend of “all-in-one” suites often leads to feature bloat, where sellers pay for 30 different sub-tools while only utilizing three. The objective is to find the tool that fits the specific operational needs of the business without imposing a “suite tax” for unnecessary functionality.
Quick Comparison: 10 Amazon Analytics Tools at a Glance
Pricing ranges from free tiers (Keepa, SellerSprite) to $249/month for full suites like Helium 10, with dedicated P&L trackers like Sellerboard starting at just $19/month.
For sellers who need to verify their options quickly, this comparison table breaks down the 10 leading platforms based on their primary utility, cost, and data capabilities.
|
Tool |
Starting Price |
Focus Area |
Marketplaces |
Data Refresh |
Best For |
|---|---|---|---|---|---|
|
Keywords.am |
$49/mo |
Listing analytics + optimization |
21 |
Real-time |
Sellers connecting analytics to listing performance |
|
SmartScout |
$29-$199/mo |
Deep visibility into Amazon’s competitive landscape and market share |
21+ |
Daily |
Best for Agencies, sophisticated sellers, and brand operators who want deep visibility into Amazon’s competitive landscape, brand dominance, and category-level market share rather than just individual product research.. |
|
Seller 365 |
$69/mo |
FeedbackWhiz + InventoryLab + Reimbursements |
21+ |
Daily |
Best for sellers seeking an all-in-one, cost-effective solution with analytics and operational tools. |
|
Helium 10 Profits |
$39/mo |
Full-suite analytics |
21+ |
Daily |
Sellers wanting everything in one platform |
|
Jungle Scout |
$49/mo |
Sales analytics + product research |
21 |
Daily |
Product research with analytics add-on |
|
Sellerboard |
$19/mo |
Profit analytics |
21+ |
Several times/day |
Budget-conscious profit tracking |
|
Nova Analytics |
$29/mo (annual) |
P&L accuracy |
21 |
Every 30 min |
Data-driven brands needing real-time accuracy |
|
SellerSprite |
Free / $79/mo |
Keyword + product research |
10 |
Varies |
Product research and keyword intelligence |
|
Keepa |
Free / ~$20/mo |
Price + rank tracking |
12 |
Every 15 min |
Price intelligence and arbitrage |
|
ManageByStats |
Free / $59.97/mo |
Analytics + CRM |
Most global |
API sync |
Multi-account + review management |
|
Seller Legend |
$49.99/mo |
Customer analytics |
NA, EU, AU, JP |
Real-time |
Brand owners needing customer LTV |
|
Amazon Brand Analytics |
Free |
Amazon-native insights |
All |
Weekly |
Baseline brand analytics (Brand Registry required) |
How Does Each Amazon Analytics Tool Compare? (Individual Reviews)
Each tool serves a different seller archetype, from Sellerboard’s $19/month budget tracking to Helium 10’s comprehensive suite at $39-$249/month, with specialized options in between.
The following detailed reviews analyze the strengths, weaknesses, and ideal use cases for each platform.
1. Keywords.am: Best for Connecting Analytics to Listing Performance ($49–$299/mo)
Keywords.am occupies a unique position in the analytics landscape. It is not a traditional Profit and Loss accounting tool; rather, it is a listing optimization specialist that provides the context regarding why the numbers look the way they do. While standard analytics tools report that sales have dropped, Keywords.am identifies the root cause, often a disconnect between the listing’s keywords and the customer’s search intent.
The platform utilizes the TFSD Framework (Title, Features, Search Terms, Description) to provide a granular analysis of listing health. Its ASIN Audit Reports grade listings on an A+ to F scale, offering immediate visual feedback on content quality. The proprietary Keywords.am Priority Score (KPS) helps sellers prioritize which keywords to target based on a balance of volume and competition, directly influencing the organic traffic that drives revenue. The Amber AI assistant aids in drafting and refining content, which can be published directly to Seller Central. (See full features)
Honest Limitation: It is crucial to understand that Keywords.am is not a substitute for a dedicated financial P&L tracker like Sellerboard or Nova. It does not calculate COGS or reconcile FBA reimbursements. Instead, it is the essential partner to those tools. Sellers use a P&L tool to monitor financial health and Keywords.am to actively improve the conversion rates and traffic quality that determine that health.
Pricing:
* Starter: $49/month
* Growth: $129/month
* Scale: $299/month
Best For: Sellers who understand that their analytics dashboard is a reflection of their listing quality and want a dedicated tool to fix the source of performance issues.
2. SmartScout: Best for Brand & Seller Intelligence ($29–$199+/mo)
SmartScout takes a fundamentally different approach from traditional Amazon seller tools. Instead of focusing primarily on individual product research, SmartScout is designed to map the entire Amazon ecosystem, brands, sellers, traffic, and category dynamics. It helps users understand who is winning on Amazon and why, making it particularly powerful for agencies, sellers, and brands analyzing competitive strategy.
One of SmartScout’s standout capabilities is its brand and seller intelligence layer. Users can see which brands dominate specific categories, how sellers are connected to those brands, and where new opportunities exist across the marketplace. Features like Traffic Graphs, Seller Maps, Brand Reports, and Subcategory analysis help reveal where demand is concentrated and which competitors control the most visibility.
The platform is especially strong for market share visibility and competitive reconnaissance. Instead of asking “Is this product profitable?” SmartScout often answers higher-level questions like “Which brands control this category?”, “Which sellers dominate traffic?”, and “Where are the emerging opportunities?”
Weakness: SmartScout is less focused on traditional SKU-level profit analytics or launch workflows. Sellers who want granular financial dashboards or PPC management tools may need to combine them with other operational software.
Pricing:
- Basic: ~$29/month
- Essentials: ~$97/month
- Business: ~$187/month
- Enterprise / Custom tiers available
Best For: Agencies, sophisticated sellers, and brand operators who want deep visibility into Amazon’s competitive landscape, brand dominance, and category-level market share rather than just individual product research.
3. Seller 365 is a value-focused bundle ($69-$199/mo)
Seller 365 is a value-focused bundle for sellers who want analytics and the surrounding operations tools in one plan. It includes FeedbackWhiz Profits for ASIN-level profit visibility, InventoryLab Accounting for tax-ready bookkeeping, and Reimbursements (0% commission), plus additional apps for inventory management and shipping (InventoryLab), repricing (SmartRepricer), sourcing and product research (Tactical Arbitrage, Scoutify, ScoutIQ, ScoutX), and review/feedback automation and alerts (FeedbackWhiz Emails + Alerts) — starting at $69/month with a 14-day free trial.
Here is pricing for the chart:
- Entry: $69/month
- Mid: $79/month
- Top: $199/month
- Free trial: 14 days
4. Helium 10 Profits: Best All-in-One Suite ($39-$249/mo)
Helium 10 is the heavyweight of the Amazon seller software industry. Its “Profits” tool is just one component of a massive ecosystem containing over 30 different tools, ranging from the renowned Cerebro and Magnet for keyword research to inventory management and PPC automation. For a seller looking to manage their entire business from a single login, Helium 10 offers unparalleled convenience.
The Profits dashboard itself is comprehensive, offering customizable views of gross revenue, net profit, and margin trends. Because it sits within the larger suite, it integrates well with other Helium 10 functions, allowing for a smooth flow of data between keyword tracking and financial reporting. The community and training resources provided by Helium 10 are also a significant value add for newer sellers.
Weakness: The primary drawback is the cost and complexity relative to need. For a seller who only requires accurate analytics, paying for the full suite can feel like buying a dealership just to drive a car. The interface can be overwhelming due to the sheer volume of features, and the price point is significantly higher than standalone options if the other tools are not being utilized.
Pricing:
* Starter: $39/month
* Platinum: $99/month
* Diamond: $249/month
Best For: Sellers who want a single “command center” for their business and are committed to utilizing the majority of the suite’s extensive feature set.
5. Jungle Scout Sales Analytics: Best for Product Research + Analytics ($49-$129/mo)
Jungle Scout is widely recognized as the gold standard for product research, and its Sales Analytics feature serves as a solid companion to its discovery tools. The platform excels at helping sellers find profitable niches with its Opportunity Finder and Supplier Database. Once a product is live, the Sales Analytics dashboard provides a clean, user-friendly view of financial performance.
The tool includes an AI-powered insights engine that helps interpret data trends, making it particularly accessible for beginners who might be intimidated by complex spreadsheets. It tracks revenue, hidden fees, and PPC costs to give a clear picture of product profitability.
Weakness: While excellent for research, Jungle Scout’s listing optimization capabilities are secondary to its research focus, and its analytics are generally considered less granular than dedicated financial tools. It is a “research-first” platform, whereas tools like Nova are “data-first.”
Pricing:
* Starter: $49/month
* Growth Accelerator: $79/month
* Brand Owner: $129/month
Best For: Newer sellers who are in the active phase of product discovery and launching, needing a tool that bridges the gap between research and basic operational analytics.
6. Sellerboard: Most Affordable Profit Tracker ($19-$79/mo)
Sellerboard has built a massive following by doing one thing exceptionally well: providing accurate, real-time profit analytics at a price point that is hard to beat. Starting at just $19 per month, it offers a suite of features that rivals much more expensive platforms.
The dashboard provides real-time P&L data per product and per order, tracking FBA fees, PPC spend, and return costs with precision. Beyond basic analytics, Sellerboard includes inventory management, automated reimbursement recovery (a feature that often pays for the subscription itself), and email automation for review generation. Its mobile app is also highly rated, allowing sellers to check their profits on the go.
Weakness: The user interface is functional but data-heavy, which can be confusing for absolute beginners. Unlike the all-in-one suites, it lacks keyword research and advanced listing optimization tools.
Pricing:
* Standard: $19/month
* Professional: $29/month
* Business: $39/month
* Enterprise: $79/month
Best For: Budget-conscious sellers and those with lean margins who need a dedicated, powerful profit tracker without paying for the bloat of a full marketing suite.
7. Nova Analytics: Fastest Data Refresh for P&L ($29-$199/mo)
Nova Analytics targets the data-obsessed seller. This platform distinguishes itself with a claim of 99.8% P&L accuracy and a blistering 30-minute data refresh rate. While many tools update every few hours or daily, Nova’s near real-time capability allows sellers to see the immediate financial impact of pricing changes or ad spend adjustments.
Nova tracks over 200 distinct Amazon fee types, ensuring that no “hidden” charge slips through the cracks. It offers unlimited custom KPIs, allowing advanced sellers to build dashboards that reflect their specific business models. Features like A/B testing and BSR tracking add to its utility for data-driven decision-making.
Weakness: As a newer entrant (a French startup), it has less brand recognition than the giants. The entry-level plan is capped at 500 orders per month, which growing sellers might exceed quickly, and the pricing ramps up for higher volumes.
Pricing:
* Entry: $29/month (billed annually)
* Starter: $49/month
* Professional: $99/month
* Scale: $199/month
Best For: Data-driven brands and agencies that prioritize absolute financial accuracy and require the fastest possible data visibility to manage dynamic environments.
8. SellerSprite: Best Budget Keyword + Product Research (Free-$79/mo)
SellerSprite is a powerful alternative to the major research suites, offering deep data at a competitive price. It boasts one of the largest databases of Amazon keywords and provides unlimited Reverse ASIN lookups on its paid plans.
While primarily a research tool, it offers a Sales Estimator and integrates Keepa data, providing valuable market intelligence. It covers 10 marketplaces and includes features like a Product Tracker that helps monitor competitor performance.
Weakness: It is strictly a research and intelligence tool, not a P&L or profit tracker. It does not connect to a seller’s account to calculate COGS or net margin. Its marketplace coverage is smaller (10 markets) compared to the 21+ supported by global analytics tools.
Pricing:
* Free Plan
* Basic: $32.50/month (annual)
* Standard: $79/month
Best For: Sellers focused on product discovery and keyword intelligence who want a cost-effective alternative to Helium 10 or Jungle Scout for research purposes.
9. Keepa: Best Price Intelligence + Historical Data (Free-$20/mo)
Keepa is legendary in the Amazon seller community. It is not an analytics tool in the sense of tracking a seller’s own profit, but it is the definitive source for market analytics. Keepa tracks price history, sales rank, and Buy Box ownership over years, providing a historical context that no other tool matches.
With a database of over 5.8 billion products and data refresh rates as fast as 15 minutes, Keepa allows sellers to see exactly how a product has performed over time. Its chart overlays are essential for understanding price elasticity and sales velocity trends.
Weakness: Keepa does not track a seller’s COGS, advertising spend, or net profit. It is purely a market intelligence tool.
Pricing:
* Free Tier: Basic access to charts
* Premium: ~€19/month (approx. $20)
Best For: Arbitrage sellers, wholesale buyers, and private label sellers who need deep competitive intelligence and historical pricing data.
10. ManageByStats (Carbon6): Best for Customer CRM + Analytics (Free-$59.97/mo)
ManageByStats, now part of the Carbon6 ecosystem, offers a unique blend of financial analytics and customer relationship management (CRM). It provides clear profit dashboards and KPI monitoring, but its standout features revolve around customer data.
The tool includes extensive review management and email automation capabilities, allowing sellers to maximize social proof. It also offers features to segment customer data (where Amazon allows), helping sellers understand repeat purchase behaviors. The “Retriever” add-on for reimbursement recovery is another strong point.
Weakness: The interface can feel somewhat dated compared to newer, sleeker tools. Users may also experience upsell pressure to adopt other tools within the Carbon6 suite.
Pricing:
* Free Plan: Limited features
* Pro: $59.97/month
* Enterprise: Custom
Best For: Sellers managing multiple accounts who place a high priority on customer management and review generation alongside their financial tracking.
11. Seller Legend: Best for Customer Lifetime Value Analysis ($49.99-$99.99/mo)
Seller Legend is a sophisticated tool for advanced sellers who need to go beyond basic profit tracking. Its defining feature is its focus on Customer Lifetime Value (LTV). The platform can segment customers into gold, silver, and bronze tiers based on their purchasing habits, providing invaluable data for brand building.
In addition to LTV, it offers a real-time profit dashboard, an account valuation tool (useful for those planning an exit), and a feature to identify unauthorized resellers. Its PPC dashboard is also highly capable.
Weakness: It has a higher starting price ($49.99/mo) than competitors like Sellerboard, making it less accessible for new sellers. It also lacks keyword research capabilities.
Pricing:
* Starter: $49.99/month
* Advanced: $59.99/month
* Professional: $69.99/month
* Enterprise: $99.99/month
Best For: Established brand owners who need to understand customer behavior and LTV to inform long-term strategy.
12. Amazon Brand Analytics: Free Baseline Analytics (Free)
Amazon Brand Analytics is the native data solution provided directly by Amazon. Available for free to sellers who have completed Brand Registry, it offers insights that third-party tools can only estimate.
Key reports include Search Query Performance (showing the funnel from impression to purchase), Top Search Terms, Demographics, and Market Basket Analysis (what else customers buy with your products). Because this data comes directly from the source, it is 100% accurate regarding consumer behavior on the platform.
Weakness: It is not a P&L tool. It does not track costs, fees, or net profit. The data usually refreshes weekly, meaning it is not suitable for real-time decision-making.
Best For: Every Brand Registered seller should use this as a baseline intelligence layer alongside a paid P&L tool.
How Much Do Amazon Analytics Tools Actually Cost? (Pricing Breakdown)
Amazon analytics tools range from free (Keepa, Amazon Brand Analytics) to $249/month for full suites, with most dedicated profit trackers costing $19-$99/month depending on order volume and features.
Understanding the true cost of analytics requires looking at the “price per order.” A tool that costs more might actually be cheaper if it serves a high-volume business effectively, whereas a cheap tool might be expensive if it fails to scale.
|
Tool |
Entry Tier |
Mid Tier |
Top Tier |
Free Trial |
|---|---|---|---|---|
|
Keywords.am |
$49/mo |
$129/mo |
$299/mo |
Free trial |
|
Helium 10 |
$39/mo |
$99/mo |
$249/mo |
Limited free |
|
Jungle Scout |
$49/mo |
$79/mo |
$129/mo |
7 days |
|
Sellerboard |
$19/mo |
$29/mo |
$79/mo |
30-60 days |
|
Nova Analytics |
$29/mo (annual) |
$99/mo |
$199/mo |
14 days |
|
SellerSprite |
Free |
$79/mo |
$157.50/mo |
3 days |
|
Keepa |
Free |
$20/mo |
$20/mo |
Free forever |
|
ManageByStats |
Free |
$59.97/mo |
Custom |
Free plan |
|
Seller Legend |
$49.99/mo |
$69.99/mo |
$99.99/mo |
21 days |
|
Amazon Brand Analytics |
Free |
Free |
Free |
N/A |
Cost Per Order Analysis:
The math reveals significant differences in value. For a seller processing 500 orders a month:
* Sellerboard at $19/month results in a cost of $0.038 per order.
* Helium 10 Diamond at $249/month results in a cost of $0.50 per order.
That is a 13x difference in operational cost. While Helium 10 offers more tools, the seller must ask if they are deriving 13 times the value from those additional features. If the primary need is profit tracking, the specialized tool offers vastly superior unit economics.
Hidden Costs:
Sellers should be aware that some “free” plans are essentially funnels for aggressive upselling. Advertised low prices often require an annual commitment. For example, Nova Analytics’ $29/mo entry price is billed annually; month-to-month options are often 20-30% more expensive.
How Do You Choose the Right Amazon Analytics Tool for Your Business?
Choose based on three factors: monthly order volume, primary analytics need such as P&L tracking versus research, and whether analytics should connect to listing optimization.
The “best” tool is relative to the stage of the business. Here is a framework for selecting the right stack:
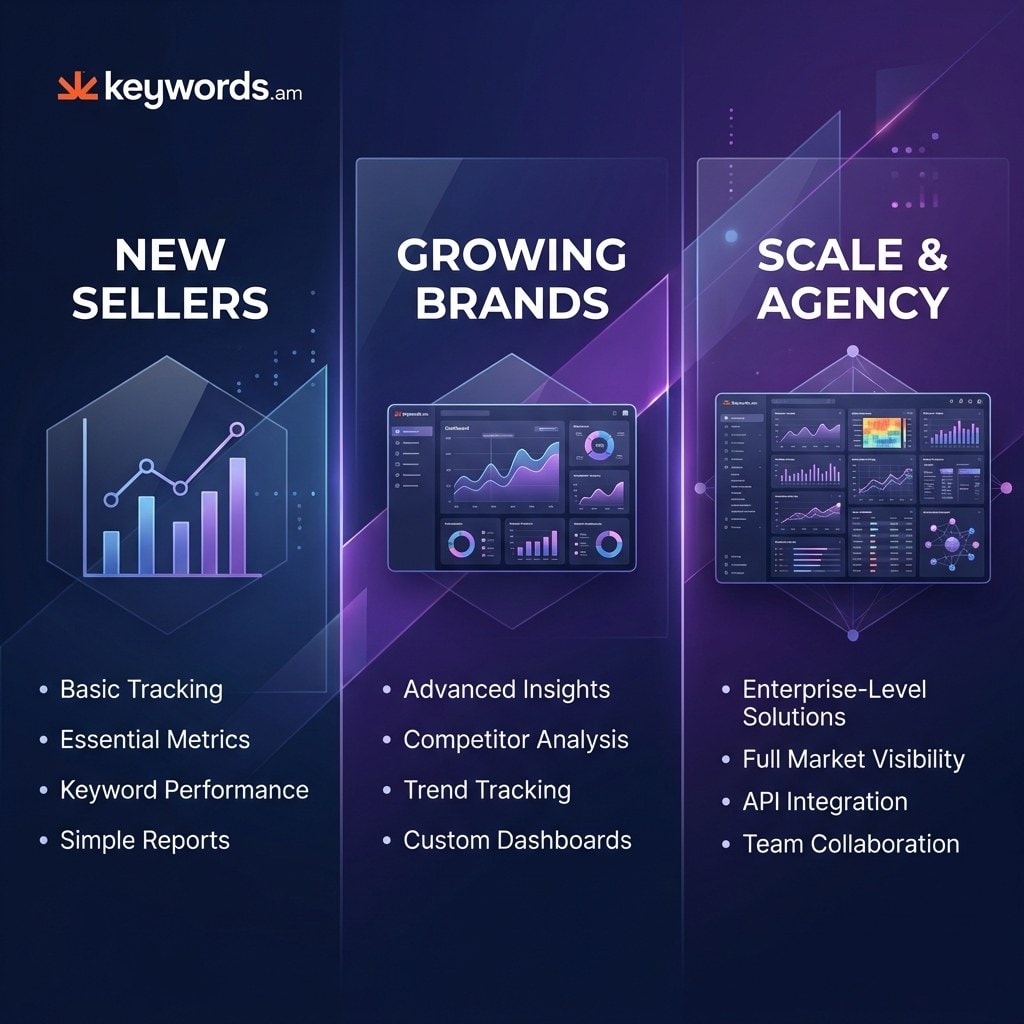
New Sellers (<500 orders/mo):
Avoid overspending on infrastructure before you have revenue.
* Recommendation: Use Amazon Brand Analytics (Free) for data + Keepa (Free tier) for price checks + Sellerboard Standard ($19/mo) for P&L.
* Total Cost: $19/month. This lean stack provides professional-grade profit tracking without burning runway.
Growing Sellers (500-5,000 orders/mo):
At this stage, optimization becomes key to margin preservation.
* Recommendation: Nova Analytics or Sellerboard for deep financial data + Keywords.am for listing optimization.
* Total Cost: ~$49-$89/month. This pairing ensures you know what your profit is (Analytics) and gives you the tools to improve it by fixing listing conversion issues (Keywords.am).
Scaling Brands (5,000+ orders/mo):
For high-volume sellers, data latency is the enemy.
* Recommendation: Nova Professional or Helium 10 Diamond for enterprise-grade analytics + Keywords.am Scale for agency-level optimization reports.
* Total Cost: $219-$369/month. When managing this volume, the ROI is measured in recovered margins and time saved, rendering the subscription cost negligible.
Agencies:
Agencies need multi-account management and white-label reporting.
* Recommendation: ManageByStats or Nova for consolidating client accounts + Keywords.am Scale for generating branded audit reports to demonstrate value to clients.
Frequently Asked Questions About Amazon Analytics Tools
Q1: What is the best free Amazon analytics tool?
Amazon Brand Analytics offers the best free analytics for brand-registered sellers, while Keepa provides free price tracking and sales rank history for all sellers.
Additional Context: ManageByStats also offers a genuinely functional free plan that includes KPI dashboards and review management for up to two seller accounts, making it a strong contender for those needing basic CRM features without a subscription.
Q2: Do I need a separate analytics tool if I already have Helium 10?
Not necessarily; Helium 10’s Profits dashboard covers basic P&L tracking, but dedicated analytics tools like Sellerboard or Nova offer deeper profit accuracy and faster data refresh.
Additional Context: The decision depends on usage. If a seller primarily uses Helium 10 for keyword research (Cerebro) but finds the Profits dashboard slow or lacking specific fee details, adding a $19/mo focused tool like Sellerboard can be a cost-effective upgrade for financial clarity.
Q3: How accurate are Amazon profit tracking tools?
Accuracy varies significantly; Nova Analytics claims 99.8% P&L accuracy by tracking 200+ fee types, while simpler tools may miss 10-30% of Amazon’s hidden charges.
Additional Context: The discrepancy often lies in how tools handle “edge case” fees like removal orders, inbound placement service fees, and adjustments. A tool that only pulls basic settlement data will always be less accurate than one that reconciles every transaction line item.
Q4: What’s the difference between Amazon analytics tools and listing optimization tools?
Analytics tools track financial performance (revenue, profit, fees), while listing optimization tools improve the content and keywords that drive those numbers; they’re complementary, not competing.
Additional Context: Think of analytics as the car’s dashboard: showing speed, fuel level, and engine temperature. Listing optimization is the engine tune-up that actually improves the car’s performance. Tools like Keywords.am focus on listing optimization (the “engine”) while Sellerboard focuses on the “dashboard” (financials). The best results come from using both.
Q5: How often should Amazon analytics data refresh?
For most sellers, several-times-daily refresh is sufficient, but high-volume sellers making pricing decisions benefit from 30-minute refresh rates offered by tools like Nova Analytics.
Additional Context: Real-time data is critical for dynamic pricing strategies. If a competitor drops their price at 9 AM, a seller with real-time data can respond by 9:30 AM. A seller with daily updates might not respond until the next day, losing a full day of sales volume.
Q6: Can Amazon analytics tools help with international selling?
Yes, tools like Sellerboard and Nova Analytics support 21+ marketplaces, consolidating multi-marketplace P&L into a single dashboard with currency conversion.
Additional Context: Marketplace coverage is a key differentiator. While tools like SellerSprite cover 10 markets and Keepa covers 12, the global leaders like Sellerboard and Nova cover 21+, allowing for a unified view of a global Amazon business.
Q7: What Amazon analytics metrics matter most for FBA sellers?
True per-unit profit (after ALL fees), TACoS (total advertising cost of sales), inventory turnover rate, and return rate by SKU are the four metrics that most directly impact FBA profitability.
Additional Context: Many sellers focus on “vanity metrics” like gross revenue or Best Seller Rank (BSR). However, a product with high revenue but negative net margin is a liability. True per-unit margin is the only metric that compounds wealth; a $30 item with a 25% margin is far superior to a $50 item with a 12% margin.
Conclusion
The landscape of Amazon analytics in 2026 is defined by precision. The days of estimating profits on a spreadsheet are over; the complexity of Amazon’s fee structure demands automated, algorithmic accuracy.
- Complementary Forces: The most successful sellers understand that analytics and listing optimization are two sides of the same coin. Financial tools reveal the health of the business, while listing optimization tools provide the lever to improve that health.
- Avoid the “Suite Tax”: Most sellers do not need to spend $250/month on software. A focused stack of free tools plus a dedicated P&L tracker often outperforms an expensive all-in-one suite for a fraction of the cost.
- Data Latency Matters: As competition speeds up, the value of real-time data increases. Sellers operating at scale cannot afford 24-hour delays in their financial intelligence.
Immediate Action:
Take ten minutes today to audit your current analytics setup. If you are a new seller, sign up for Amazon Brand Analytics (it’s free) and pair it with a low-cost tracker like Sellerboard. If you are an established brand, evaluate whether your current “all-in-one” tool is actually giving you the P&L accuracy you need.
Remember that data is only as good as the action it inspires. Use your analytics to identify underperforming SKUs, then use a listing optimization tool like Keywords.am to fix the root cause of the problem, transforming data into profit.