
⚡ TL;DR
- Images drive ranking: Product images affect CTR and conversion rates, directly influencing organic search rank through Amazon’s behavioral feedback loop.
- 7-slot framework: Each image slot serves a specific purpose, from earning the click (slot 1) to closing the sale (slot 7).
- Infographics carry keywords: Text overlays should match exact search terms from keyword research, not generic feature descriptions.
- A+ alt text is hidden real estate: A+ content image alt text fields provide additional keyword placement for long-tail terms that don’t fit in titles or bullets.
- Main image wins the click: Maximize product fill to 85-90% of the frame and A/B test variations to improve CTR.
- Audit for keyword alignment: Listing image audits should check both technical compliance and whether infographic text still matches current target keywords.
Three out of four Amazon shoppers say product images drive their purchase decisions. Despite that, most sellers treat images as a photography exercise disconnected from their keyword strategy.
They’ll spend hours optimizing titles, bullets, and backend keywords but leave their images unconnected to the same search terms driving traffic. This gap costs sales. A listing can have stunning professional photography and still fail to address the specific objections buyers are typing into the search bar.
This guide connects amazon product image optimization to keyword research. It covers requirements, the 7-slot sequencing framework, and the hidden keyword real estate in A+ content images. Most guides teach camera settings. This one teaches how images serve the same keyword strategy as every other listing element.
What are Amazon’s product image requirements in 2026?
Amazon requires product images to be at least 1600 pixels on the longest side, use JPEG/PNG/TIFF format, and show the product on a pure white background for the main image.
Meeting the basic technical specifications keeps a listing active. The main image carries the strictest rules. The product must fill 85% or more of the frame. Sellers can’t include text, graphics, logos, or badges. The background must be pure white (RGB 255,255,255). Violating these core rules causes immediate listing suppression. A suppressed listing stops generating sales instantly, which is why Amazon’s official image requirements should be the first stop for any new product launch.
Secondary images offer creative freedom. Sellers can use lifestyle shots, infographics, comparison charts, and text overlays in slots two through seven. These slots allow brands to communicate value visually.
Requirement |
Specification |
Why It Matters |
|---|---|---|
Minimum dimensions |
1600 x 1600 px (longest side) |
Enables zoom function |
Preferred dimensions |
2000 x 2000 px |
Sharper zoom on mobile |
File formats |
JPEG, PNG, TIFF, GIF (non-animated) |
JPEG recommended for file size |
Main image background |
Pure white (RGB 255,255,255) |
Mandatory for search results |
Product fill |
85%+ of image frame |
Maximum visibility in grid |
Max file size |
10 MB per image |
Larger files slow loading |
Color mode |
sRGB or CMYK |
sRGB for web display |
Max image slots |
7 images + 1 video |
All 7 should be used |
Main image restrictions |
No text, logos, badges, watermarks |
Causes suppression |
Alt text (A+) |
Available in A+ Content modules |
Keyword placement opportunity |
Meeting these specs is table stakes. The question is what goes INTO each image slot.
How do Amazon product images affect search ranking?
Images affect ranking by improving click-through rate, which drives more sessions, which boosts conversion signals, which improves organic rank.
Amazon’s A10 algorithm leans on behavioral signals to rank products. When a listing appears in search results, the main image is the primary hook. Higher click-through rates tell Amazon the product matches the query, which drives more sessions to the listing page.
Here’s where it compounds: once shoppers land on the page, secondary images convince them to buy. More conversions reinforce the product’s relevance, which pushes the listing higher for that keyword. It’s a self-reinforcing cycle. Any listing optimization strategy that ignores this behavioral loop is leaving rank on the table.
The numbers back this up. YES Bar ran an A/B test on their main image through PickFu and the winning variation drove a 12% traffic lift — $3,390 in additional revenue over two weeks and a 133% sales increase. One image change. That’s the leverage at stake.
Amazon Rufus AI adds another layer to this dynamic. Rufus analyzes image content to generate product recommendations and answer buyer questions. Visual content now directly informs Amazon’s AI understanding of the product. Sellers can use category-average CTR data from Seller Central’s Business Reports to benchmark their performance and identify where amazon product image optimization efforts should focus first.
What should go in each of the 7 Amazon image slots?
The 7 slots follow a strategic sequence: main product shot, scale context, features infographic, lifestyle, comparison, packaging, and social proof.
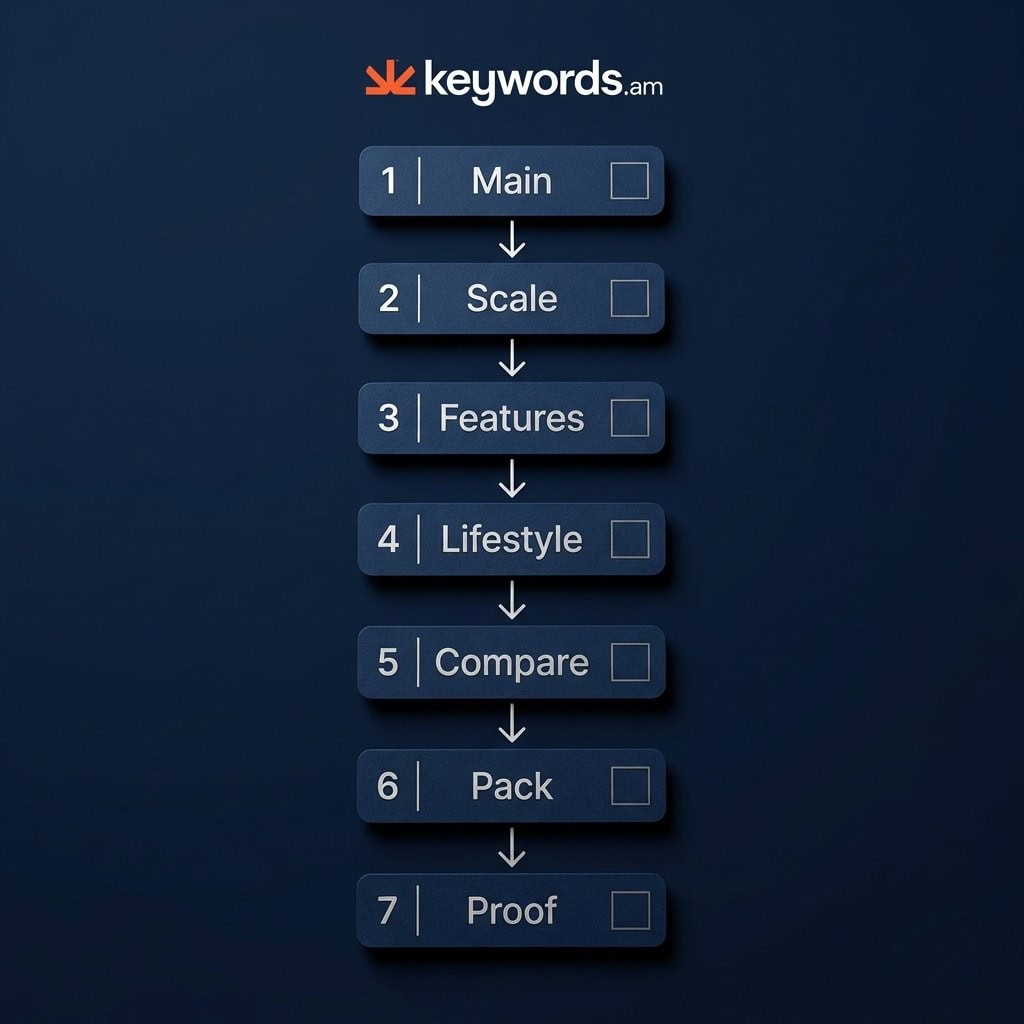
The sequence guides the buyer through a logical evaluation process:
Slot 1: Main product on pure white (the click-earner). This is the only image shoppers see in search results. Clarity and product fill are critical here.
Slot 2: Scale and size context (the expectation setter). Show the product in hand, next to a common object, or with labeled dimensions. This prevents negative reviews about unexpected sizing.
Slot 3: Key features infographic (the keyword carrier). Text overlays on this image should echo the target terms from the TFSD framework guide. The infographic acts as a visual layer of the keyword strategy.
Slot 4: Lifestyle or in-use shot (the imagination trigger). Show the product solving the exact problem the target customer faces.
Slot 5: Comparison or before/after (the objection handler). Address the primary buyer hesitation identified during keyword research.
Slot 6: Packaging or what’s included (the trust builder). Set accurate expectations and reduce return rates.
Slot 7: Social proof or certifications (the confidence closer). Reviews, awards, or technical certifications. This is the last image before the buy decision.
The main image deserves special attention because it’s the only one shoppers see before clicking.
How do sellers optimize the Amazon main image for higher CTR?
Maximize product fill to 85-90%, ensure sharp zoom detail, choose differentiating angles, and A/B test variations with Manage Your Experiments.
Product fill percentage controls visibility on small screens. The product should dominate the frame — 85-90% of the available space. A tiny product swimming in white will lose the click to a competitor whose product looks bigger and more substantial every time. This visual impact, combined with product title optimization, creates the first impression that earns or loses the click.
Color psychology matters more than most sellers realize. Products with contrasting colors against white backgrounds consistently pull higher CTR in crowded search grids. Angle selection is another quick win. Pull up page one for the target keyword and look at what everyone else is doing. If every competitor shows a front view, try a 45-degree angle. Differentiation grabs attention.
A/B testing removes the guesswork. Brand-registered sellers can use the free Manage Your Experiments feature to test different main images and let data declare the winner. For an immediate check, try the shelf test: shrink the main image to thumbnail size on a monitor. If the product becomes unrecognizable, the image requires resizing and cropping.
Once the main image earns the click, infographic images do the selling.
How do infographic images connect to keyword strategy?
Use text overlays that match exact search terms from keyword research, turning each callout into a visual keyword reinforcement.
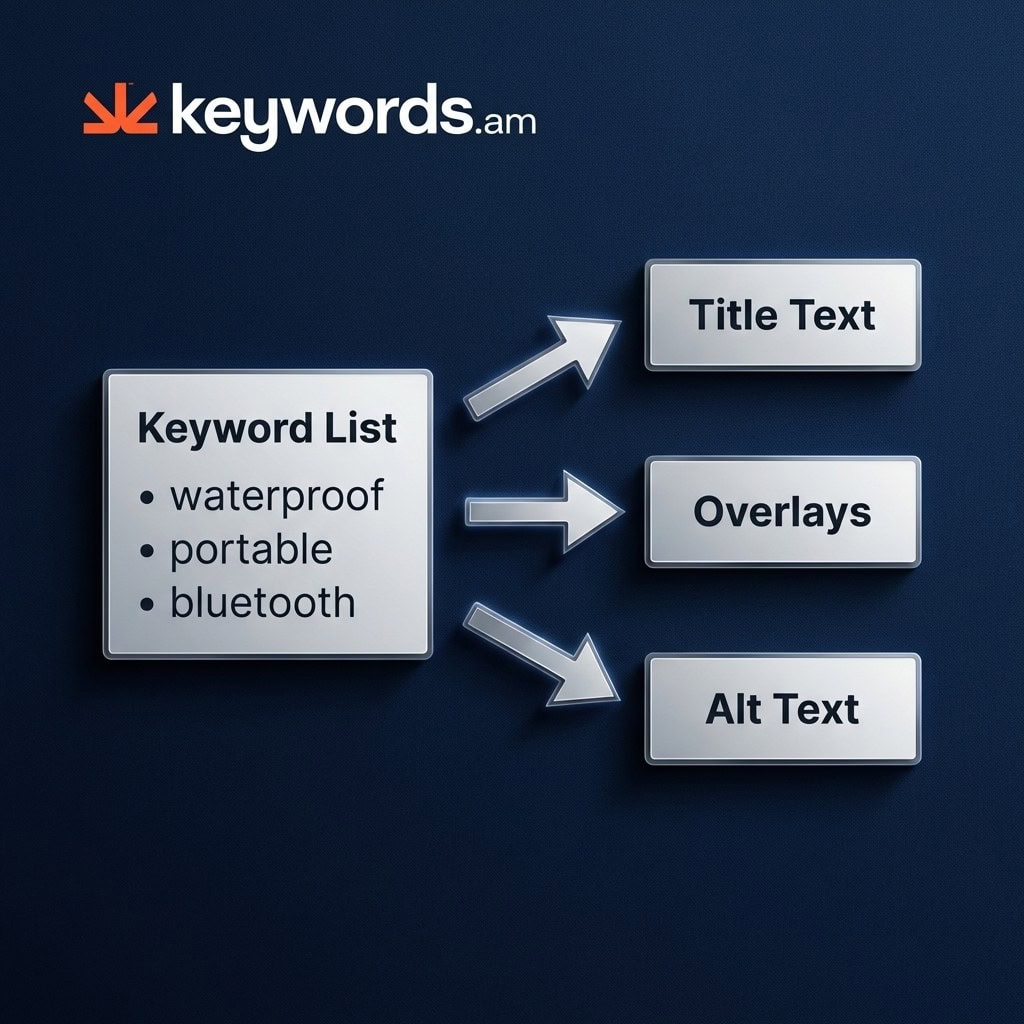
The text overlays need to use the exact phrases identified during TFSD research. If “waterproof bluetooth speaker” is a primary target keyword, the infographic callout should say “Waterproof” — not “Water Resistant,” not “Splash Proof.” Those alternatives create a disconnect between what the buyer searched and what the image confirms. Match the search language. Following the TFSD framework guide ensures visual assets align with the terms that actually drive traffic.
Each text box on an infographic is a chance to reinforce a secondary keyword. Think about a dog bed listing: callouts like “Orthopedic Memory Foam” and “Machine Washable Cover” don’t just describe features — they address specific search variations directly in the image. Best listing optimization tools can surface which secondary terms deserve that visual placement.
Comparison charts in image format can tackle “vs” keywords visually — a graphic comparing a “bluetooth speaker vs wired” directly answers comparison search intent without words. But design matters: over 70% of Amazon traffic comes from mobile devices. If the text on an infographic isn’t readable at phone screen size, it’s wasted real estate. Stick to 30pt font minimum, high contrast, and three to five callouts max per image.
This connection between keyword research and image design is what separates strategic amazon product image optimization from basic product photography.
How does A+ content image alt text extend keyword indexing?
A+ alt text fields let sellers place keywords that don’t fit in titles or bullets, expanding the listing’s keyword footprint.
Every A+ Content module includes a backend image alt text field. Amazon’s systems can read these fields. Amazon hasn’t publicly confirmed that alt text directly influences A10 ranking — but the fields are crawlable, and they do contribute to the listing’s overall keyword footprint. Smart sellers treat A+ content optimization as keyword real estate, not just a design exercise.
Using alt text for long-tail keywords
The play is long-tail keywords. These are terms that can’t fit within the strict 200-byte title limit or 500-byte bullet point constraints. Once sellers understand Amazon character limits, finding alternate locations for valuable keywords becomes a priority. A+ alt text is one of the best overflow locations available.
Text overlays in Enhanced Brand Content
Enhanced Brand Content text overlays work the same way. The visible text baked into A+ image modules should map to target keywords. Terms that score high on relevance but don’t justify placement in the main title or features? They belong in A+ image alt text and visual overlays.
The TFSD framework guide identifies these overflow keywords, ensuring no valuable search terms are discarded simply due to space constraints. This approach transforms amazon product image optimization from a visual exercise into a comprehensive keyword coverage strategy.
How should sellers audit their Amazon listing images?
Check compliance with Amazon requirements, evaluate each slot, test main image CTR, and verify infographic text matches current keywords.
Image compliance checklist
The audit begins with technical verification:
- Dimensions: Every image meets the 1600px minimum (2000px preferred)
- File size: Under 10 MB per image
- Main image rules: White background, no text/logos/badges, 85%+ product fill
- Suppression triggers: No watermarks, no promotional text, no lifestyle elements on the main image
A proactive Amazon listing audit tool automates much of this verification and ensures listings remain active and visible.
Keyword alignment check
Look at the infographic callouts. Do they still match current target keywords? Search trends shift with seasons and competitor moves. The text on images should evolve alongside the keyword strategy — stale callouts are missed opportunities.
Check session rate and conversion rate in Seller Central’s Business Reports. These are the ground truth metrics for image effectiveness. Low sessions? The main image isn’t earning clicks. Low conversion? The secondary images aren’t persuading shoppers to buy.
Reshoot vs. redesign
Here’s a decision most sellers overthink: reshoot or redesign? If the physical product hasn’t changed, updating infographic overlays with current keywords is faster and cheaper than booking a new photo shoot. This iterative approach belongs in every listing optimization checklist.
The Keywords.am ASIN audit report flags image compliance issues as part of the overall listing health score, providing a clear starting point for amazon product image optimization efforts.
Frequently Asked Questions About Amazon Product Image Optimization
These are the most common questions sellers ask about amazon product image optimization.
Conclusion
Amazon product images are a keyword strategy problem dressed up as a photography problem. Treating them as a visual exercise alone means missing the chance to communicate directly with search algorithms and buyer intent.
- The 7-slot framework transforms random product photos into a sequenced sales argument.
- Infographic overlays visually reinforce the specific search terms driving traffic to the listing.
- A+ content alt text provides hidden fields to expand a listing’s keyword footprint without cluttering visible text.
- Main image optimization directly influences the click-through rate required to trigger Amazon’s ranking algorithm.
Audit the infographic text overlays on a best-selling listing today. Check if the callouts match current target keywords from recent TFSD research. Updating a few text overlays is often the fastest path to improved conversion. Use an Amazon listing audit tool to verify image compliance and identify immediate opportunities for optimization.