
📑 Table of Contents
- What Is Amazon A/B Testing and Why Does It Matter?
- Who Can Use Amazon’s Manage Your Experiments?
- What Can You A/B Test on Amazon?
- How Do You Decide What to Test First?
- How Do You Set Up an A/B Test in Seller Central?
- What Are the Most Common Amazon A/B Testing Mistakes?
- How Do You Interpret Amazon A/B Test Results?
- What Tools Support Amazon A/B Testing Beyond Manage Your Experiments?
- Amazon A/B Testing Case Study: Data-Driven Hypothesis to Results
- Frequently Asked Questions About Amazon A/B Testing
- Conclusion
⚡ TL;DR
- Amazon A/B testing (Manage Your Experiments) lets Brand Registry sellers test listing elements with 50/50 traffic splits
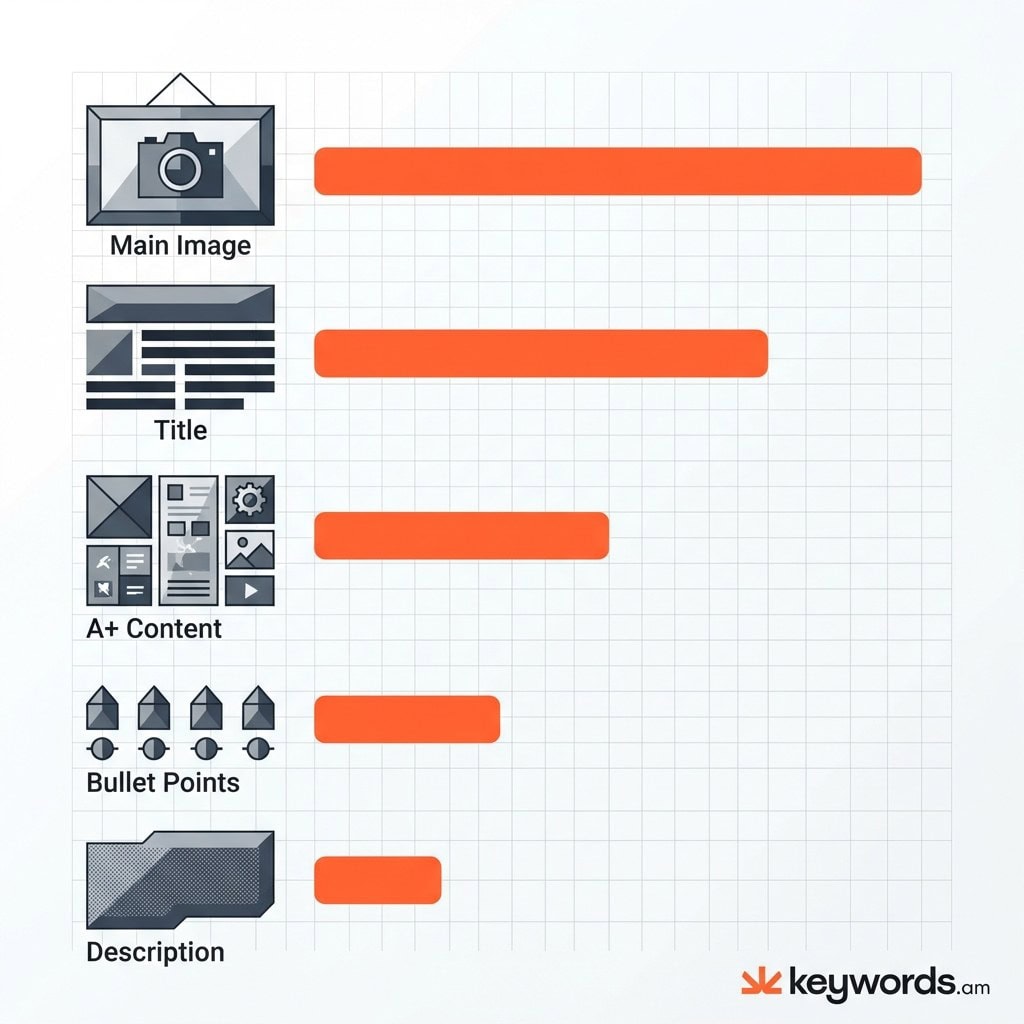
- Prioritize tests by impact: Main Image → Title → A+ Content → Bullets → Description
- Generate hypotheses from keyword data, not intuition – test terms you’re missing but competitors rank for
- Wait for 95% statistical significance before implementing winners; never stop tests early
- Run one variable test at a time per ASIN to isolate what’s actually driving results
- Avoid testing during Prime Day or Black Friday – shopper behavior skews results
- Continuous testing is essential: the market evolves, so should your listings
Amazon sellers can see big gains. Amazon claims A/B tests can boost sales up to 25%. That’s a lot, right? But, honestly, a lot of sellers still just go with their gut feeling. They change their listings based on what *they* happen to like. Not based on data. And in my experience? That’s a mistake you don’t want to make.
There’s a difference. It’s huge. There’s just running tests, and running *smart* tests. Randomly swapping out your main image, or tweaking a title for no good reason? Examples of time wasted. Weeks can go by and you end up with data that doesn’t actually *teach* you anything. You won’t learn what customers want. And you certainly won’t figure out how to actually improve conversion rates in a systematic way.
This guide? It’ll give you a solid plan to follow. It’s about using Amazon’s Manage Your Experiments feature in a smart way. Here’s the thing though: it’s not *just* about how to use the interface. The following sections go into more detail than that. They’ll explain how to come up with data-driven ideas before you start a test. Look, by using keyword data to spot where your listings are weak, you can actually change A/B testing. It won’t be a guessing game anymore. It becomes a precise way to make things better.
What Is Amazon A/B Testing and Why Does It Matter?
Amazon A/B testing compares two versions of a listing element to determine which drives more sales. Brand-registered sellers access this through Manage Your Experiments in Seller Central.
Amazon A/B testing? It’s pretty much about figuring out what works best for your product listings. Think of it as a scientific approach to selling online. Amazon gives you a controlled testing environment. Half your potential buyers see one version of your listing (Version A, or the control). The other half see a slightly different version (Version B).
Amazon keeps tabs on clicks and sales from each version. So, you see which one performs better. It takes guesswork out of the equation. For example, a seller might prefer a simple image. But if a lifestyle image actually gets more clicks, well, more clicks equal more money.
The impact can be big. Small improvements here and there really add up. A 1% boost in conversion from one test might seem small. That said, what if you applied that across your titles, bullet points, and A+ Content? Worth noting: Amazon Listing Optimization Ultimate Guide explains listing optimization is key for ranking. And a listing that converts well signals relevance to Amazon’s A9 algorithm. This gets you more traffic. It’s kind of a flywheel effect. Amazon claims A/B testing can get you a 25% sales increase. But the reality is that kind of jump usually comes from lots of small tweaks over time, not one magic bullet.
Look, A/B testing reduces risk. In the past, you updated a listing and just crossed your fingers. And if sales dropped? You wouldn’t really know why. Was it the picture? The time of year? Competitor pricing changes? With Manage Your Experiments, the tests happen simultaneously. This cancels out things like holiday shopping patterns. Both versions are being shown at the same time. The results tell you what content performed best.
Who Can Use Amazon’s Manage Your Experiments?
Manage Your Experiments requires Brand Registry enrollment and sufficient ASIN traffic. Products must have enough weekly page views to generate statistically valid results.
So, who can actually use Amazon’s A/B testing? It’s not available to just anyone. Amazon Brand Registry is essential. Honestly, if you aren’t brand registered, you’re out of luck. You need to be brand registered to get access to Manage Your Experiments (MYE). It’s for sellers with registered brands, those who own the trademarks. This encourages serious branding and respect for intellectual property. Sellers without Brand Registry are stuck with less reliable, manual approaches.
But that’s not the only requirement. Your specific ASIN needs enough traffic, a lot of it. Amazon doesn’t say exactly how many visitors are needed, but the system considers recent traffic. Here’s the thing though: the product must get “high-intent” traffic, so the test results are reliable within 8-10 weeks. An ASIN with only a few views a day won’t work. It would take ages to find a winner.
And Manage Your Experiments? It’s usually for successful products, not brand new ones no one sees.
For sellers whose products don’t have enough traffic, don’t start testing yet! Focus on increasing traffic first. Investing in Amazon PPC (Pay-Per-Click) advertising is a good start, in my experience. Finding traffic from other sources is, too. That said, this can get page views to the right level. Worth noting: once the product hits the needed traffic number, Manage Your Experiments appears. The reality is, your seller account must be in good standing, too. Suspensions or rule violations can prevent access to brand tools.
What Can You A/B Test on Amazon?
Amazon allows A/B testing of five listing elements: product images, titles, bullet points, product descriptions, and A+ Content including videos and comparison charts.
The reality is you can test a lot more in Seller Central these days. Pretty much everything visual and text-based on your product page is up for grabs.
Product Titles
Titles are important! And both for Amazon and for actual shoppers. A/B tests on titles? It’s usually about structure and keyword placement.
For example: starting with your brand and main keyword versus starting with a benefit. What works best? Title length, too! Is a short, sweet title better than a long, detailed one? Titles show up in search results. So, changes here affect Click-Through Rate (CTR) and Conversion Rate (CVR).
Main Images
The main image gets the clicks. No click, no buy. Obvious, right? Experiments often play with different angles, lighting, and packaging. Amazon has image rules (white background, 85% product size, etc.). That said, there’s still room to play.
Is the product in its box better than just the product itself? Does a 3D render beat a good photo? The results can surprise you.
Bullet Points
These are “above the fold” on computers. They’re where you close the deal a lot of the time. A/B tests here? It’s about persuasion, kind of.
You could have a tech-focused version (size, materials, power). Then, a benefits-driven version that focuses on how it makes people feel. Mix up the order! If you move your warranty promise from bullet five to bullet two, how does that change things? Worth noting: for a deeper understanding, the Amazon Bullet Points Guide offers extensive strategies.
Product Descriptions
If you don’t have A+ Content, the description is your last shot to sell with words. A/B tests here… see if a story beats a list of features. Honestly, computers don’t always show this section prominently. But, it’s front and center on phones! Test it, especially for considered purchases.
A+ Content
But, if you’re Brand Registered, A+ Content (Enhanced Brand Content) replaces the description. You can customize things! Sellers can test layouts. “Image Heavy” (big pictures) versus “Text Heavy” (lots of details). Comparison charts are good for testing, too. They affect whether people buy better versions.
|
Element |
Impact Potential |
Test Priority |
Best For Testing |
|---|---|---|---|
|
Main Image |
Very High |
1 |
Click-through rate |
|
Product Title |
High |
2 |
Search visibility + CTR |
|
A+ Content |
High |
3 |
Conversion rate |
|
Bullet Points |
Medium-High |
4 |
Conversion rate |
|
Description |
Medium |
5 |
Conversion rate |
How Do You Decide What to Test First?
Prioritize testing based on data, not intuition. Start where keyword coverage gaps reveal missed opportunities – if you’re not ranking for high-intent terms, your listing content is likely the cause.
Honestly, the biggest mistake in A/B testing is the “spaghetti approach.” It’s throwing stuff at the wall, seeing what sticks. And that’s a waste. For example, a seller might think: “I’ll test a blue background in my A+ content because I like blue!” But that’s not a hypothesis. It’s just a whim. The reality is, a good hypothesis is: “If I change X, I expect Y to happen because of Z.” Tests are aimless without the “because.”
So how do you make good hypotheses? Sellers have to look at the data. In my experience, keyword coverage data provides a clear guide for finding what’s missing from a listing. If you sell a “Stainless Steel Travel Mug,” and competitors rank for “Insulated Coffee Tumbler” but you don’t, that’s a gap. The hypothesis? Clear: “If I add ‘Insulated Coffee Tumbler’ to the title and bullet points, the listing will index for these terms. This will increase visibility and conversion among coffee drinkers.”
Keywords.am‘s coverage indicators act like a diagnostic tool. By scanning your listing against the market, the tool highlights relevant keywords—present and missing. It removes the guesswork. Here’s the thing though: say the data shows zero coverage for “leak-proof lid,” but reviews mention it constantly. You rewrite the bullet points to emphasize this feature using those keywords. It’s that simple. This approach makes sure every test is based on potential market opportunity. It isn’t about whether you like blue.
The prioritization matrix for testing should balance Impact Potential with Ease of Testing and Data Confidence. Main Image tests? High impact, but expensive. Think photographer costs! Title tests are high impact too. Worth noting, it costs nothing but typing. But if the keyword data gives high confidence that a term drives competitor sales, the Title test wins. And reference to the Coverage Indicators Explained resource? It can give context on interpreting these signals. You’ll want to read that.
How Do You Set Up an A/B Test in Seller Central?
Navigate to Brands > Manage Your Experiments in Seller Central, select your ASIN, choose the element to test, create both versions, and launch. Amazon handles traffic splitting automatically.
Honestly, setting up an A/B test in Seller Central is pretty straightforward. The interface is designed to prevent major headaches. It all starts in Seller Central under the “Brands” menu. Then you click “Manage Your Experiments.” It takes you to the main spot for all your tests – the ones running, the planned ones, everything. So, you want to set up a new test? Just click “Create a New Experiment.”
Step 1: Select the Experiment Type
Amazon asks what exactly you plan to test. Choices include Bullet Points, Main Image, Product Title, and A+ Content. Just pick what you need! Then you need to select the right ASIN. Here’s the thing though: you have to pick an eligible ASIN. They have to meet Amazon’s criteria. If an ASIN isn’t eligible, it’ll be grayed out, or you won’t see it at all.
Step 2: Define the Variations
You’ll see your current listing as “Version A” (Control). Then, you add your new content for “Version B” (Treatment). If it’s images or A+ Content you’re changing, make sure your files are ready to go. Amazon recommends that the variations are quite different. And, in my experience, I agree completely. If Version A and Version B are, say, 95% the same – maybe just one word changed – it’s going to be hard to see a real difference. The goal is to offer shoppers a real choice.
Step 3: Configuration and Launch
You can set the length of the experiment. Tests run for 4 to 10 weeks, usually. But, in my experience, you should let the test run until you reach statistical significance. Don’t just end it on a certain date. Amazon offers an “Auto-publish” option. Pick it, and Amazon updates the listing with the winning version. Worth noting: this only works if there’s a clear winner. It’s a good option if you prefer a hands-off approach. That said, you have to trust the numbers.
Click “Schedule Experiment.” Amazon double-checks the new content. They make sure it follows all their guidelines. Assuming it’s all good, the test goes live. Data collection starts. Don’t change the listing while the test is running! You’ll mess everything up.
What Are the Most Common Amazon A/B Testing Mistakes?
The biggest mistakes are testing too many variables at once, stopping tests before reaching statistical significance, and ignoring seasonality effects that skew results.
Look, even with Amazon’s Manage Your Experiments, things can still go wrong. Testing too many things? It’s a big problem.
A seller, excited to see a boost, changes the main image, title, and price all at once. Sales go up! Great, but what caused it? Was it the image? New price? Snappy title? No way to know, because they changed too much. An A/B test changes *one* thing. Keep everything else consistent.
Stopping a test too soon is another mistake.
The first few days? Data is kind of messy. Version B can look amazing due to random sales. But if you end it early and say Version B wins, you’re reacting to noise. Statistical significance matters a lot. It tells you if the result is real, or just chance. Amazon shows you this; ignoring it is a mistake. You’ll think you found something when you didn’t.
Seasonality matters a lot, too. Testing a pool floatie in December won’t give you results like testing in July. Obvious, right? It gets more subtle, though. Running a test during Prime Day or Black Friday skews things. Shoppers buy faster and care about price. A title that wins during Prime Day might fail any other week. Worth noting: it’s often smart to pause tests during big sales events to keep your data clean.
And finally, small changes don’t help. Changing “Buy Now” to “Buy Today” in a bullet point? It won’t matter; you won’t be able to measure it. But bold tests give you clear data, in my experience. Tests need to be bold. White background vs. a lifestyle background? That’s bold. A title about features vs. one about benefits? Also bold!
How Do You Interpret Amazon A/B Test Results?
Amazon shows probability percentages indicating which version performs better, plus metrics like units sold per visitor and conversion rate. Implement the winner only when probability exceeds 95%.
So, when you finish an A/B test, Amazon gives you a results dashboard. It’s got a bunch of data. The main thing? “Probability that Version B is better than Version A.” It’s a percentage number. Honestly, this is easy to mess up. Thinking a high number is a sure thing. But it isn’t! If Amazon says 80% chance Version B wins, Version A still has a 20% chance.
In my experience, aim for 95% before you do anything. It’s the statistical significance standards most people use. Sellers should be careful about acting prematurely.
And the dashboard shows “Units Sold per Unique Visitor.” That said, that’s pretty much the conversion rate. For the test group. Comparing A and B? That tells you how much sales change.
And Amazon includes a “One Year Impact” guess. It’s how much MORE money you’d make in a year. Don’t forget it’s just a guess. Worth noting this gives you a feel for the possible financial upside.
“Inconclusive” results are common. The reality is, these can tick off sellers. It means no clear winner. That said, it’s not all bad news. It shows the change didn’t move the needle for customers.
But that’s not all! Inconclusive results send you places. Say you test a new photo and get “inconclusive.” Maybe the photo isn’t the issue. Maybe it’s price or the reviews. So, look there.
What Tools Support Amazon A/B Testing Beyond Manage Your Experiments?
Beyond Manage Your Experiments, sellers use keyword research tools to generate hypotheses, listing audit tools to identify optimization gaps, and manual testing methods for elements Amazon doesn’t support.
Manage Your Experiments is the main tool. But honestly, you need other stuff to know *what* to test. Keyword research tools are totally essential first. They scrape Amazon, showing search volume. This helps you decide what keywords matter. A term gets 50,000 searches and your listing doesn’t rank? Title test, high priority.
Listing audit tools give you a detail page structural look. They check character counts, image resolution, backend search terms and point out issues. Best Amazon Listing Optimization Tools reviews software that automates finding these issues. Bullet points shorter than average? Test longer bullet points!
If you aren’t Brand Registered or MYE doesn’t support what you need (like price), manual testing is still possible. But it’s flawed. It’s “Time-Based Testing”—Version A for 2 weeks, Version B for 2 weeks, sales data comparison. It requires discipline. You log change dates, watch for market weirdness that messes with data. A competitor runs out of stock, for example.
Keywords.am’s ASIN Audit fits in. It gives you raw test ideas. And here’s the thing though, it uses the TFSD Framework—Target, Frequency, Search Volume, and Density. The tool uncovers optimization gaps often missed. Check out the TFSD Framework. Worth noting: it explains how technical keyword density relates to ranking. It offers a mathematical reason for A/B tests of your text.
Amazon A/B Testing Case Study: Data-Driven Hypothesis to Results
A stainless steel tumbler seller discovered through keyword analysis they weren’t ranking for “insulated travel mug.” Adding this term to their title in an A/B test increased conversion rate by 18%.
Look, I’ve seen this happen a lot. It’s all about home goods listings and getting them just right. So, imagine a seller; they’ve got a really nice stainless steel tumbler. Sales are…okay. But they’ve hit a wall, right? Good reviews, a decent price, all that jazz. The title? It’s got the brand and “Tumbler” plastered all over it.
But digging into the keywords can reveal a lot. They’re ranking page one for “Tumbler,” sure. For “Travel Mug” and “Insulated Coffee Cup,” though? Nowhere to be found! The reality is, those search terms get a lot of volume. We’re talking about a whole different customer base searching for the same kind of thing in a different way.
So, the seller has a thought. “If I add ‘Insulated Travel Mug’ to the title, I bet I can grab some extra traffic and boost conversion.”
They used Manage Your Experiments to set up an A/B test.
That said, here’s what the variations looked like:
* Version A (Original): [Brand Name] 20oz Stainless Steel Tumbler with Lid, Double Wall Vacuum Sealed…
* Version B (Test): [Brand Name] Insulated Travel Mug – 20oz Stainless Steel Coffee Tumbler with Leak-Proof Lid…
And running the test is key. It ran for 4 weeks. The result? Pretty clear, actually. Version B crushed it. A 97% probability of confidence! Conversion was 18% higher. Honestly, it’s pretty amazing.
By matching the product language to what customers search for—using data, not just guessing—the seller basically found a whole new revenue stream. It shows how important keyword research is to A/B testing, in my experience. Worth noting – don’t skip keyword research!
Frequently Asked Questions About Amazon A/B Testing
Q1: How long do Amazon A/B tests take?
Most Amazon A/B tests take 4-10 weeks to reach statistical significance. Tests end automatically when Amazon has enough data to declare a winner confidently.
Honestly, it varies a lot. Duration? It all comes down to traffic, really. High traffic? You’ll see results quicker. In my experience, some wrap up in about 4 weeks. But low traffic? That’ll drag on. More data is needed to be confident. Here’s the thing though: don’t ever stop a test yourself. Wait for Amazon to decide. Otherwise, you’ll mess up the whole process, so be patient.
Q2: Can I run multiple A/B tests at the same time?
Yes, you can run A/B tests on different ASINs simultaneously. However, avoid testing multiple elements on the same ASIN at once to keep results interpretable.
You can test lots of different ASINs at the same time. That’s totally fine. But testing a title on Product A and then, say, an image on Product B? That works. Doing both on Product A at the same time though? Bad idea, and the system might even block you. Why’s it a bad idea? Because you won’t know the reason for the sales change. Was it the title, or the image driving things? It gets so confusing.
Q3: What happens if my A/B test is inconclusive?
Inconclusive tests mean neither version significantly outperformed the other. This is valuable data – try testing more dramatically different versions or different elements.
Inconclusive isn’t failure, I promise you! It’s actually data! That said, it just means customers didn’t notice a real difference. So? Try bigger changes next time. Or test something different altogether. Time to pivot!
Q4: Can I A/B test without Brand Registry?
Amazon’s Manage Your Experiments requires Brand Registry. Without it, you can manually test by changing listings and comparing sales data over time, though this method is less reliable.
No, you can’t use Amazon’s Manage Your Experiments tool without Brand Registry. Bummer, I know it’s annoying. Without it, you’re stuck with manual testing. Pre-post analysis, basically. It’s pretty vulnerable to seasonality. Plus, market shifts can also mess things up. Securing Brand Registry? The best step for any serious seller out there, I reckon. You’ll get access to a lot better tools.
Q5: How do I know if my sample size is big enough?
Amazon handles sample size automatically. The platform will alert you if your ASIN doesn’t have enough traffic, and tests continue until reaching statistical significance regardless of timeline.
Amazon handles all of it. Relax! If your ASIN doesn’t have enough traffic, Amazon will definitely tell you. Tests run until they’ve reached significance. Don’t worry about doing any calculations! Amazon’s got this one for you.
Q6: Should I test my best-selling products or underperformers?
Test high-traffic products first because they reach statistical significance faster and have more room for absolute sales improvement from percentage gains.
Test your best sellers first. They reach significance a lot faster. And there’s more room for sales growth. A 10% increase on 100 units/day? That’s huge, right? Same increase on 2 units/day? Not so much impact. Plus, high-traffic products finish testing faster in general. Weeks instead of months is possible. So, prioritize the big sellers first.
Q7: Can A/B testing hurt my rankings?
Properly conducted A/B tests shouldn’t hurt rankings. Amazon’s system splits traffic equally and measures conversions – if one version performs worse, Amazon detects this quickly.
It really shouldn’t hurt your rankings. Amazon splits traffic evenly. It measures conversions too. Bad version performing poorly? Amazon notices it pretty quickly. Worth noting: the actual risk is very small. You’re not removing the listing, after all. You’re trying to improve it. The potential downside is temporary, and the upside? It’s pretty massive.
Q8: How often should I run A/B tests?
Run continuous A/B tests on your top ASINs. When one test concludes, start another targeting a different element. Optimization is ongoing, not a one-time project.
Test. Constantly. Always be running tests on your top ASINs out there. One test finishes? Start another one right away! The market changes fast, honestly. Competitors update their listings, keywords start trending, tastes change too. Is a “perfect” listing possible today? It might be outdated tomorrow. So, you have to keep on testing to stay competitive.
Conclusion
The reality is, data makes or breaks Amazon businesses. Seriously though. A/B testing? It’s how you turn hunches into real, measurable advantages.
Key takeaways:
* A/B testing without a hypothesis? That’s just expensive guessing, honestly.
* Keyword data shows you what’s missing. And, importantly, it shows you what to test.
* What should you test first? Here’s my take. Main Image is probably first. Then Title. A+ Content is next. And then Bullets. Finally Description.
* Run tests until they’re statistically significant. Don’t quit early! Honestly, I see people quit way too soon.
* Document everything. Otherwise, you’ll repeat old mistakes. So, keep good records.
Immediate action:
Check one of your best ASINs for keyword gaps. Seriously. Any high-intent terms missing? Boom. First test hypothesis. It’s pretty easy to do.
Ready to find out what your listings are missing? Keywords.am’s coverage indicators show you the keywords to target. Data turns into testable hypotheses.