
📑 Table of Contents
- Why Do Amazon Seller Tools Show Different Numbers?
- What Are the 7 Causes of Amazon Data Discrepancies?
- Which Amazon Data Source Should Sellers Trust?
- When Should Sellers Worry About Data Discrepancies?
- How Does Transparent Data Methodology Improve Amazon Decisions?
- Frequently Asked Questions About Amazon Data Accuracy
- Conclusion
⚡ TL;DR
- Discrepancies are systemic, not bugs. Amazon’s own reports disagree with each other due to timezones, metric definitions, and refresh delays.
- Seven root causes drive the differences: UTC vs. PST timezones, ordered vs. settled metrics, 48-hour report lag, BSR estimation algorithms, parent/child ASIN aggregation, pending orders, and API rate limits.
- Match the source to the decision. Settlement reports for profit, SP-API for inventory, Brand Analytics for keywords, estimation tools for directional competitive research.
- 10-30% variance between estimation tools is normal. Only investigate when first-party report discrepancies exceed 5% or estimation gaps surpass 30%.
- Transparent methodology matters more than claimed accuracy. Tools that expose confidence levels and data sources enable better decisions than black-box estimators.
A seller checks the estimated monthly sales for a single kitchen gadget ASIN across three different platforms. Helium 10 reports 2,400 units sold. Jungle Scout estimates 3,800 units. Seller Central shows 1,950 units. This scenario is not a glitch, but a fundamental feature of the Amazon data ecosystem.
Conflicting data points lead to incorrect inventory forecasts and wasted ad spend. Sellers who do not understand why these numbers differ cannot make informed decisions about where to invest capital. When inventory mismanagement costs businesses billions annually, the issue of amazon data accuracy becomes a critical financial concern.
This guide breaks down the seven root causes of data discrepancies, provides a definitive source-of-truth hierarchy, and offers a diagnostic framework. Unlike advice that claims one tool is “most accurate,” this analysis reveals why no single tool can be universally correct.
Why Do Amazon Seller Tools Show Different Numbers?
Amazon seller tools show different numbers because they use different data sources, estimation algorithms, and reporting timeframes that Amazon’s own infrastructure never unifies.
Amazon seller tools show different numbers because they rely on different data sources, estimation methods, and reporting timeframes that Amazon’s own infrastructure does not unify. True amazon data accuracy is elusive because the ecosystem is fragmented by design.
Seller Central dashboards, the Selling Partner API (SP-API), the Advertising API, and Brand Analytics each serve data with different latencies. A sale recorded in the Advertising API might not appear in the SP-API for hours. Even Amazon’s own internal reports often disagree; “Business Reports” frequently show different totals than “Payments” for the exact same date range.
Third-party tools face an additional challenge: they must estimate competitor sales using proxy signals. Amazon does not reveal exactly how many units a competitor sold. Instead, tools track Best Seller Rank (BSR) and inventory levels, applying proprietary algorithms to estimate volume. Because each tool uses a different algorithm trained on a different dataset, estimates inevitably diverge.
What Are the 7 Causes of Amazon Data Discrepancies?
The seven causes are timezone mismatches, metric definition conflicts, data refresh delays, estimation algorithm variance, ASIN aggregation differences, pending order fluctuations, and API rate limiting.
Achieving amazon data accuracy requires navigating seven distinct obstacles: timezone differences, report definition mismatches, data refresh delays, estimation methodology variance, ASIN aggregation inconsistencies, pending order fluctuations, and API rate limiting.
1. Timezone Differences
The most frequent cause of “missing” sales is timezone differences. Amazon’s SP-API records data in UTC, while Seller Central displays PST.
Consider a sale at 11:00 PM PST on January 15th. In Seller Central, this counts towards January 15th. But 11:00 PM PST is 7:00 AM UTC on January 16th. Therefore, an API-connected tool reports this sale on January 16th. Comparing daily totals creates false discrepancies purely due to this shift.
2. Report Definition Mismatches
“Sales” is not a universal metric. There is a critical distinction between “Ordered Product Sales” and “Settled Product Sales.”
- Ordered Product Sales (Business Reports) counts orders when the customer clicks “Buy Now,” including cancellations.
- Settled Product Sales (Payment Reports) counts orders only after payment processes and the item ships.
Comparing an “Orders” report from one tool against a “Settled” report from another results in a discrepancy, often 5-10%, as the settled report excludes cancellations.
3. Data Refresh Delays
Data latency varies significantly. Seller Central dashboards are “near-real-time,” updating within 15-60 minutes. However, downloadable reports often lag up to 48 hours.
The SP-API has specific constraints documented in Amazon’s official API guidelines; FBA inventory reports are often cached and limited to requests every 30 minutes. If a tool requests data at 12:00 PM and returns a cached report from 11:30 AM, recent sales will be missing until the next refresh. This creates temporary discrepancies that usually resolve after 24 hours.
4. Estimation Methodology Differences
When analyzing competitors, tools rely on estimation. Each major tool has a proprietary algorithm to convert Best Seller Rank (BSR) into estimated sales.
These algorithms are trained on different datasets. If Tool A’s training data is heavy on electronics, it might be accurate for headphones but less so for supplements. Accuracy typically ranges from 60% to 80%. A “1,000 sales/month” estimate could realistically represent 600 to 1,400 units. Treat these numbers as directional signals.
5. Parent vs. Child ASIN Aggregation
For products with variations, reporting becomes complex. Some tools aggregate all sales to the Parent ASIN, while others estimate sales for each Child ASIN.
If Tool A reports total family sales (1,200 units) and Tool B reports the best-selling variation (400 units), the numbers look different but are measuring different things. Sellers must verify whether a number refers to the specific variation or the rolled-up family.
6. Pending Orders and Returns
Orders can remain “Pending” for days during payment verification. Furthermore, returns process days or weeks later.
When a return occurs, Amazon deducts the value from the sales total. A report for “Last Month” viewed on February 1st might show $10,000, but drop to $9,800 when viewed on February 15th due to processed returns. Tools that capture a snapshot without re-syncing will show the original figure.
7. API Rate Limiting and Data Gaps
Amazon strictly enforces rate limits on its SP-API. If multiple tools request the same report simultaneously, Amazon may reject requests.
If the API remains congested, data gaps occur. A tool might miss a block of orders because it was denied access. Amazon advises against having multiple applications request the same data simultaneously. Without a manual re-sync, these gaps result in permanent holes in historical data.
Feature |
Seller Central |
Tool A (API-Based) |
Tool B (Scraper/Extension) |
Cause of Discrepancy |
|---|---|---|---|---|
Timezone |
PST/PDT |
UTC |
Local Browser Time |
Sales shift to adjacent days |
Metric |
Ordered Sales |
Ordered or Shipped |
Estimated Sales |
Definitions (Placed vs. Settled vs. Est.) |
Latency |
~1 Hour |
~1-4 Hours |
Real-time (snapshot) |
Refresh delays & caching |
Status |
Dynamic (updates with returns) |
often Static (snapshot) |
Static (snapshot) |
Handling of returns/pending |
Which Amazon Data Source Should Sellers Trust?
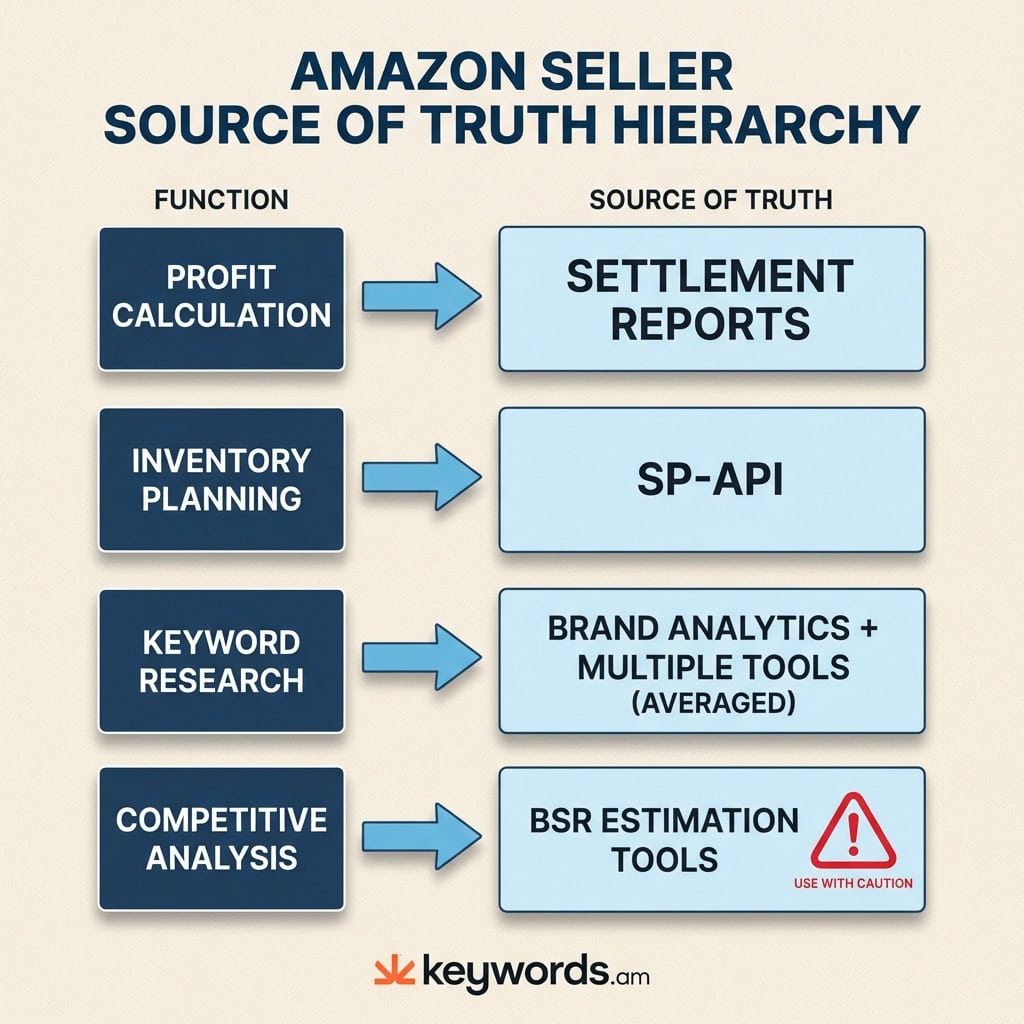
The most trustworthy source depends on the decision: settlement reports for profit, SP-API for inventory, Brand Analytics for keywords, and estimation tools for directional competitive research.
The trustworthy data source depends on the decision. Sellers often seek one “perfect” number, but the authoritative source shifts by use case. Establishing a baseline for amazon data accuracy involves utilizing the correct report for the specific business function.
Source of Truth Hierarchy
Use Case |
Best Data Source |
Why |
Avoid |
|---|---|---|---|
Profit Calculation |
Settlement Reports |
Reflects actual disbursements, fees, and refunds. |
Dashboard “Sales” widgets (ignore fees/returns). |
Inventory Planning |
SP-API + Seller Central |
Real-time stock levels, FBA inbound status. |
Third-party sales estimates. |
Keyword Research |
Brand Analytics + Multi-Tool Avg |
First-party search data + cross-referenced volume. |
Relying on a single third-party tool’s volume. |
Competitive Analysis |
BSR-Based Estimation Tools |
The only viable option for competitor data. |
Treating estimates as exact facts. |
Ad Performance |
Advertising API / Campaign Manager |
Direct first-party performance data. |
Attributing total sales growth solely to ads. |
For Profit Calculation, Settlement Reports are the only source that matters, detailing exactly what Amazon deposited. Dashboard numbers are “vanity metrics” here.
For Keyword Research, no single third-party tool has perfect visibility. Amazon’s Brand Analytics provides a precise Search Frequency Rank. Combine this with average search volumes from reputable analytics tools to reduce risk.
For Competitive Analysis, use estimation tools but trust the trend rather than the integer. If a tool shows a competitor selling 5,000 units, treat it as “High Volume.” This protects decision-making from false precision.
When Should Sellers Worry About Data Discrepancies?
A 5-15% variance between estimation tools is normal, but discrepancies above 30% or inconsistencies in first-party reports signal a configuration problem worth investigating.
A 5-15% variance between tools is normal for estimation-based metrics, but discrepancies above 30% or in first-party reports signal a data configuration problem.
Acceptable Variance Ranges
- Sales Estimates (Tool vs. Tool): 10-30% variance is typical. Different algorithms weight recent BSR spikes differently.
- Dashboard vs. Downloaded Reports: <5% variance is expected due to timezone differences and report lag.
- Settlement vs. Order Reports: Can differ significantly (10%+) depending on returns and payment processing.
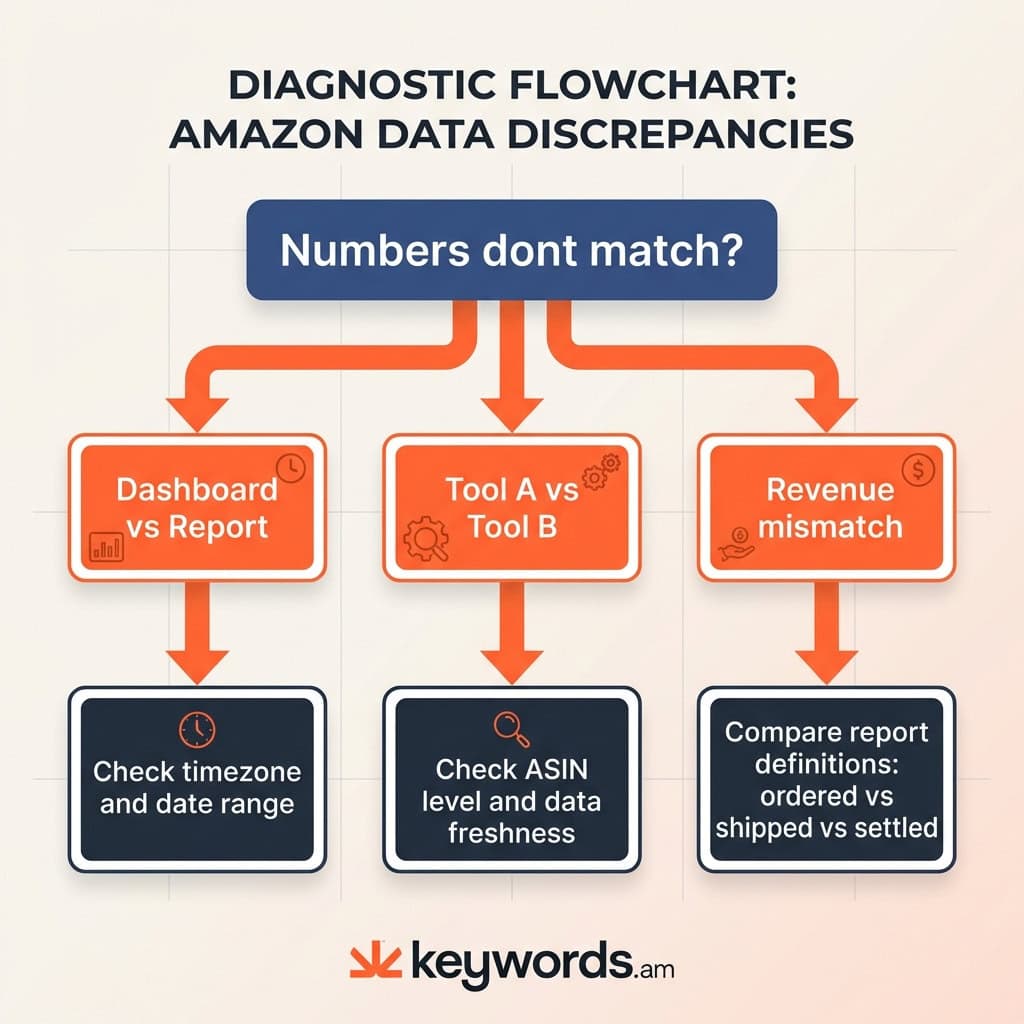
Diagnostic Troubleshooting Checklist
If numbers fall outside these ranges, use this diagnostic sequence:
- Check Timezone & Dates: Are both sources set to the same date range? Is one UTC and the other PST?
- Verify ASIN Level: Is the tool looking at a Child ASIN while Seller Central reports on the Parent ASIN?
- Compare Report Definitions: Is one source reporting “Ordered Product Sales” (gross) and the other “Settled Product Sales” (net)?
- Check Data Freshness: If a competitor tool shows zero sales for an active product, it may not have scraped that ASIN recently.
- Audit Account Connections: Check if API tokens have expired in Seller Central.
- Review Excluded Transactions: Ensure filters for promos or giveaways are not hiding valid sales data.
How Does Transparent Data Methodology Improve Amazon Decisions?
Transparent methodology reveals how numbers are calculated and their confidence levels, letting sellers distinguish reliable metrics from rough estimates.
Transparent data methodology means a tool shows how it derives numbers and its confidence level.
Opaque “black box” tools present numbers as facts without context. Without knowing if data is hard (API) or soft (estimated), sellers cannot evaluate reliability. True amazon data accuracy depends on knowing the data’s pedigree.
A transparent methodology answers:
1. Source: API, scraped, or estimated?
2. Confidence: How much data supports this?
3. Freshness: When was this last updated?
4. Type: Measured fact or calculated probability?
For example, Keywords.am utilizes coverage indicators to address this. Instead of a flat number, these indicators show how much data is available, distinguishing “High Confidence” from “Low Confidence” estimates. Structured methodologies like the TFSD framework move optimization toward a verifiable process, where sellers can audit listings against a standard rather than relying on a tool’s secret “grade.”
Frequently Asked Questions About Amazon Data Accuracy
Helium 10 and Jungle Scout use different proprietary BSR-to-sales algorithms trained on different datasets. Neither has access to actual competitor sales data. Both estimate volume based on Best Seller Rank history. Cross-referencing both often provides a more reliable range than trusting either implicitly.
Most estimators achieve 60-80% accuracy on average. High-volume products with stable BSR tend to have more accurate estimates. Niche products or those with volatile BSR swings may see error rates exceeding 50%. No third-party tool matches Seller Central’s precision.
Seller Central dashboards display near-real-time data in Pacific Time, while downloaded reports use UTC with up to 48 hours of processing delay. Dashboards are for quick checks; reports are for accounting. Aligning timezones usually resolves these discrepancies.
Settlement reports are the most accurate for profit tracking because they reflect actual disbursements including fees and refunds. Business Reports show “Ordered Product Sales” (gross revenue) and ignore cancellations. The Settlement Report is the only valid source for true profitability analysis.
Brand Analytics provides first-party search frequency data directly from Amazon. While it lacks absolute volume numbers, the relative ranking (“Search Frequency Rank”) is highly accurate. It is the gold standard for understanding relative keyword demand for brand-registered sellers.
Dashboard data is near-real-time (15-60 min delay). SP-API FBA reports update every 30 minutes minimum. Settlement reports generate every two weeks. Third-party tools relying on these APIs will always lag slightly behind actual stock levels.
Conclusion
The frustration of conflicting numbers is manageable. The key is to stop searching for a single “correct” number and understand the ecosystem. Data discrepancies are usually symptoms of a complex infrastructure where timezones and estimation methods collide, not tool failures.
Key Takeaways:
* Context is King: Know if a number is a hard metric or a soft estimate.
* Match the Source: Use Settlement Reports for the wallet, SP-API for the warehouse, and estimates for the war room.
* Expect Variance: A 10-30% difference between estimates is standard.
* Value Transparency: Tools exposing confidence levels are safer bets.
Immediate Action:
Compare the last fully closed week of sales in Business Reports (Ordered Sales) against the Settlement Report (Settled Sales). Note the variance percentage. This “baseline error rate” prevents panic when discrepancies appear, because the seller will know exactly how much is just “Amazon being Amazon.”
For sellers evaluating their analytics stack, exploring how Keywords.am’s coverage indicators and Amazon SEO tools approach data transparency can provide a clearer baseline for decisions.