
📑 Table of Contents
- How Does an Amazon FBA Calculator Work?
- The 7 Best Amazon FBA Calculators Compared (2026)
- What Does a Real FBA Profit Calculation Look Like in 2026?
- What Are the 5 FBA Fee Mistakes That Calculators Expose?
- Why Does Keyword Optimization Affect FBA Profitability More Than Fee Estimation?
- Frequently Asked Questions About Amazon FBA Calculators
- Conclusion
⚡ TL;DR
- Amazon’s free Revenue Calculator provides a baseline but often omits inbound placement and aged inventory fees.
- SellerApp and Helium 10 offer multi-marketplace support and ASIN lookup features missing from free versions.
- A realistic 2026 profit calculation must account for returns processing and Q4 storage spikes to be accurate.
- Common fee mistakes include using January storage rates year-round and ignoring the impact of packaging dimensions on size tiers.
- Fee estimation is only the cost side of profitability. Keyword optimization drives the revenue side: better keywords lead to higher conversion, stronger organic rank, and lower PPC dependency.
Amazon sellers paid over $140 billion in FBA fees in 2025, yet most use an Amazon FBA calculator that misses at least two critical fee categories. The difference between a healthy 15% margin and a dangerously thin 3% margin often comes down to fees the calculator never showed.
With over seven major FBA calculator tools available ranging from free browser extensions to $30/month subscription tools, sellers face a difficult decision. They must determine which tool provides trustworthy data and whether the output includes all the fees that impact the bottom line.
This article compares all seven major Amazon FBA calculator tools side by side, walks through a real profit calculation with every 2026 fee line item, and explains the profitability variable that no calculator can estimate for you.
How Does an Amazon FBA Calculator Work?
An Amazon FBA calculator estimates net profit by subtracting referral fees, fulfillment fees, storage costs, and other Amazon charges from a product’s selling price.
Here’s what happens under the hood: plug in three numbers (selling price, product cost, and shipping to Amazon), and the calculator strips out Amazon’s fee layers one by one. Referral fees hit your account first. They usually run between 8% and 15% depending on your product category. Fulfillment fees hit next based strictly on size and weight tiers. Then storage fees stack up every single month. The better tools also factor in inbound placement fees and aged inventory surcharges, but plenty of free calculators skip those entirely.
If you’re brand new to the platform, start with the basics: what is Amazon FBA explains the fundamentals. The real gap between free and paid calculators? Data depth. Free tools cover the basic fee structure. Paid tools add ASIN lookup, historical data, and support for multiple marketplaces.
Knowing what a calculator does matters less than knowing which one gets the numbers right.
The 7 Best Amazon FBA Calculators Compared (2026)
The best FBA calculators for 2026 include Amazon’s free Revenue Calculator for basics, Helium 10 for ASIN lookup, and SellerApp for FBA-vs-FBM comparison across 16 marketplaces.
Every amazon fba calculator gets some fees right and misses others. What catches most sellers off guard is the sheer number of fee categories that exist now (seven, easily more depending on your product mix) versus the three or four that budget tools bother to calculate. The table below breaks down what you’re actually getting from each option.
Software Tool |
Pricing |
Marketplaces |
ASIN Lookup |
FBA vs FBM |
Ideal For |
|---|---|---|---|---|---|
Amazon Revenue Calculator |
Free |
1 (US) |
Yes |
No |
Baseline fee checks |
Helium 10 |
Free tier / $29+/mo |
13+ |
Yes |
No |
Serious sellers wanting ASIN data |
Jungle Scout |
Free (web) / $49+/mo |
17 |
No (manual input) |
No |
Product research integration |
SellerApp |
Free (Chrome) |
16 |
Yes |
Yes |
Multi-marketplace FBA vs FBM |
ProfitGuru |
$29/mo |
1 (US only) |
Yes |
No |
Per-seller sales breakdown |
AMZScout |
Free (Chrome) |
12 |
Yes |
No |
Beginners wanting quick estimates |
Seller Assistant |
$15.99/mo |
All major |
Yes |
Yes |
Wholesale/arbitrage BSR analysis |
Novadata |
$29/mo (annual) |
21 |
Yes |
No |
Ongoing P&L tracking after launch |
1. Amazon Revenue Calculator
The Amazon Revenue Calculator is free and Amazon maintains it, so naturally it’s where most sellers go first. It covers referral fees, basic fulfillment, and standard storage costs. What it won’t tell you about: inbound placement fees, aged inventory surcharges, returns processing. That’s three entire fee categories missing from the output, and on a product with tight margins, those missing lines can mean the difference between 15% profit and breaking even. Treat the number it gives you as a floor estimate, not a final answer.
2. Helium 10 Profitability Calculator
Helium 10 has a free version that handles basics, and the paid tiers start at $29/month. Where it pulls ahead of Amazon’s own tool: you punch in an ASIN and it auto-populates dimensions, weight, and category fees without you touching a spreadsheet. The 13+ marketplace coverage is useful if you sell in the UK or Germany alongside the US. Full ASIN data and all the advanced filters sit behind the paywall, though, so budget for a subscription if you need the complete feature set.
3. Jungle Scout FBA Calculator
You don’t even need an account to use Jungle Scout’s free web calculator. Just open the page and start. Subscribers get deeper integration with Jungle Scout’s product database across 17 marketplaces, which ties nicely into product research workflows where profitability and product discovery happen in the same session. The free version requires manual input though, and there’s no FBA vs. FBM comparison.
4. SellerApp FBA Calculator
SellerApp’s free Chrome extension covers 16 marketplaces and does something most competitors don’t bother with: side-by-side FBA vs FBM comparison. If you’re on the fence about fulfillment methods, this alone could save you hours of spreadsheet work. Only caveat: Chrome-only, no standalone web version.
5. ProfitGuru
ProfitGuru runs $29/month and only works in the US. The thing that makes it worth considering? Per-seller revenue breakdowns. You can see what individual sellers actually earn on any ASIN, which is gold for competitive research. If you sell outside the US, though, look elsewhere.
6. AMZScout
AMZScout has a Chrome extension (free) that works across 12 marketplaces and shows fee estimates, profit, ROI, and projected monthly revenue right on the Amazon listing page while you browse. New sellers gravitate toward it because there’s zero setup involved. The downside is you can’t export any of the data, and the free version has ads everywhere.
7. Seller Assistant
At $15.99/month, Seller Assistant is purpose-built for the wholesale and arbitrage crowd. BSR drop tracking, ROI threshold alerts, and pricing trend analysis are the core features. The Keepa integration lets you pull 90-day or 180-day price history on any ASIN without opening a separate tab, which makes seasonal product sourcing decisions faster. You won’t get much value from the free version.
Bonus: Novadata for Ongoing P&L After the Calculator
A calculator gives you a snapshot. What happens six months later when storage rates spike and Amazon quietly bumps fulfillment fees? Novadata’s FBA Profit & Loss tracker monitors all 200+ Amazon fee types on an ongoing basis, and several sellers who switched from spreadsheet tracking told me the margin visibility alone justified the $29/month annual plan. If you’ve ever been surprised by a quarterly fee increase eating into what you thought was a 20% margin product, this is the tool that prevents that from happening again.
If you want to see where these calculators fit alongside research tools, analytics platforms, and listing optimizers, the best Amazon seller tools breakdown covers the full stack.

Comparing features on a chart is one thing. The only way to know if a calculator works for your business is to run your own product numbers through it and see whether the output survives contact with your actual bank deposits.
What Does a Real FBA Profit Calculation Look Like in 2026?
Grab a kitchen gadget off your supplier’s catalog: 12 ounces, $24.99 retail, $6.00 landed cost. Run it through every 2026 fee line and you end up with roughly $7.50 to $9.00 per unit depending on when those units sell (Q4 storage costs triple) and your category’s return rate. Below is what the math actually looks like when nothing gets left out:
Product specs:
* Item: Kitchen Gadget
* Selling Price: $24.99
* Weight: 12 oz (Standard Size)
* Landed Cost: $6.00
Fee Category |
Amount |
Notes |
|---|---|---|
Selling Price |
$24.99 |
|
Referral Fee (15%) |
-$3.75 |
Home & Kitchen category |
FBA Fulfillment Fee |
-$3.68 |
Standard size, 12 oz (2026 rate) |
Monthly Storage (Jan-Sep) |
-$0.14 |
$0.78/cubic ft, ~0.18 cu ft |
Monthly Storage (Oct-Dec) |
-$0.43 |
$2.40/cubic ft during Q4 |
Inbound Placement Fee |
-$0.30 |
Minimal split shipment |
Estimated Returns Processing |
-$0.25 |
Assumes ~5% return rate at $4.97 per return (amortized) |
Landed Cost of Product |
-$6.00 |
Factory manufacturing plus direct shipping to Amazon |
Net Profit (Jan-Sep) |
$10.87 |
43.5% margin |
Net Profit (Q4 storage) |
$10.58 |
42.3% margin |
Notice where most calculators stop counting? Line four. Everything after that, the inbound placement fee, the returns estimate, none of it shows up in the free tools. And if that inventory sits in Amazon’s warehouse past 271 days, aged inventory surcharges ($0.30 to $0.35 per unit) start stacking on top of everything else. The calculator showed 43% margin. Your disbursement report from Seller Central will tell a very different story.
Once the product is live, watching these costs over time is arguably more important than the launch-day math. The best Amazon analytics tools exist specifically for this: they track your actual margins week by week as Amazon adjusts fees, changes storage pricing, and rolls out new surcharges. For example, Novadata’s FBA Profit & Loss tracker pulls in all 200+ Amazon fee types in near real-time, keeping the gap between what a calculator estimates and what actually hits the bank account visible month over month.
The worked example assumes sellers enter the right numbers. Most don’t.
What Are the 5 FBA Fee Mistakes That Calculators Expose?
The five most common FBA fee mistakes are ignoring Q4 storage spikes, underestimating returns, forgetting inbound placement fees, using the wrong size tier, and skipping aged inventory surcharges.
A calculator is only as good as the numbers going in. And sellers keep falling into the same five traps.
1. Using January Storage Rates Year-Round
Storage fees are never flat. They triple during Q4. Costs jump from $0.78 per cubic foot to $2.40. A product taking up 0.18 cubic feet looks like $0.14/month in January. Come October, that same space costs $0.43/month. Multiply by 1,000 units and the gap starts to hurt.
2. Ignoring Returns and Refund Processing
Amazon’s average return rate sits between 5% and 15% depending on category. Each return is more than just a lost sale. It actively triggers returns processing fees ($1.78 to $6.67 per unit) plus refund administration fees on top. Most free calculators don’t even have an input field for returns. So sellers overestimate their realized margin without realizing it.
3. Forgetting Inbound Placement Fees
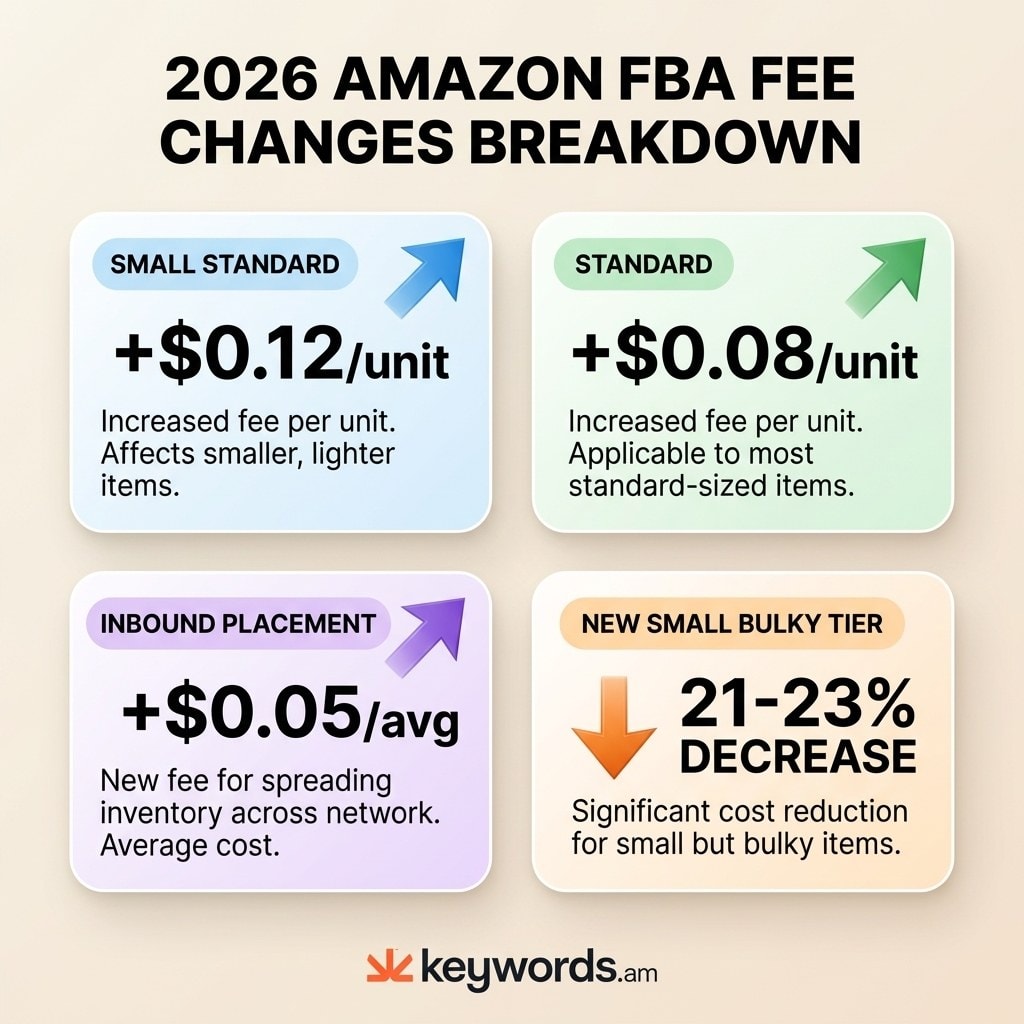
Since 2024, Amazon has charged inbound placement fees ranging from $0.21 to $0.68 per unit for shipments that are not split across multiple fulfillment centers. In 2026, these fees saw an average increase of $0.05. Sellers who fail to account for this cost often find their actual margin is $0.25 to $0.70 lower per unit than calculated.
4. Using the Wrong Size Tier
Fulfillment fees jump in tiers based on size and weight. Being 0.1 inches over a standard size threshold can push a product into large standard or oversize territory, adding $2 to $5 per unit. Always measure products in their final packaging. Amazon measures the box or poly bag, never the bare item. The full breakdown of 2026 FBA fee tiers is published on Amazon’s Selling Partners page.
5. Skipping Aged Inventory Surcharges
Inventory sitting in Amazon’s warehouses for 271 to 365+ days gets hit with surcharges from $0.50 to $6.90 per cubic foot. A product that looked profitable on day one can turn into a money pit by month ten. That’s why demand forecasting matters as much as fee calculation.
Avoiding these mistakes requires both accurate fee data and demand data.
Why Does Keyword Optimization Affect FBA Profitability More Than Fee Estimation?
Keyword optimization drives conversion rate and organic ranking, which compound profitability far more than saving a few cents per unit on fulfillment fees.
Every Amazon FBA calculator focuses on the cost side of the equation. Profitability actually has two sides: what sellers pay in fees and what they earn in revenue. Two sellers with identical products, identical landed costs, and identical FBA fees can end up with dramatically different profits. The difference comes down to organic visibility.
Consider the math. Saving $0.08 per unit on 1,000 monthly units equals $80 per month in savings. Meaningful, but modest. Now consider a seller who improves conversion rate from 10% to 15% through better keyword targeting on a $25 product. That lift produces roughly 50 additional sales per month, or $1,250 in extra revenue. The revenue side of the equation dwarfs the cost side.
The chain of effects works like this: better keywords lead to higher search visibility, which produces more organic clicks, which increases conversion rate, which reduces dependence on paid advertising, which lowers TACoS, which raises net margin. And it compounds at every step. Think about a seller spending $3 per click on PPC for a search term they could rank for organically with a properly optimized listing. That is real money left on the table week after week.
This is where product niche validation comes in. Before committing to inventory, the keyword landscape tells you whether organic visibility is even achievable for a given product or whether you’ll be stuck paying for every single click.
Already running PPC? Amazon PPC optimization strategies can cut ad spend while keyword work builds the organic rank that eventually replaces those paid clicks. Calculators handle the cost floor. Keyword research raises the revenue ceiling. You need both.
Tools like Keywords.am handle the keyword optimization side of this equation. The TFSD Framework covers research, listing drafting, and publishing to Seller Central in one workflow, helping sellers capture the revenue gains that no FBA calculator can estimate.
Before investing in any calculator tool, here are the most common questions sellers ask.
Frequently Asked Questions About Amazon FBA Calculators
These are the most common questions sellers ask about Amazon FBA calculator tools and fee calculations.
Most sellers doing well on FBA target 15-25% net margin after all fees. Anything below 10% gets dangerous fast. There is barely enough cushion for ad costs or fee hikes. The “right” margin depends on category and competition, though high-volume products can survive on thinner margins because they turn over quickly.
Start with Amazon’s free Revenue Calculator to get a baseline, then cross-check with a third-party tool that covers inbound placement and storage surcharges. Plug in the ASIN (or dimensions, weight, and category) along with the selling price. The calculator spits out referral fee, fulfillment fee, and storage cost. Subtract product cost and you’ve got net profit. For a broader look at tools that combine fee calculation with product research, see this guide to the best Amazon product research tools.
Yes. FBA is still highly profitable when sellers account for all fee layers. Amazon kept referral fees unchanged for 2026 but bumped inbound placement fees by $0.05 on average. Profitability isn’t about avoiding fees; it’s about knowing exactly which fees apply and planning around them. Sellers who use calculators covering all fee categories tend to maintain healthier margins than those guessing.
For referral and fulfillment fees, free calculators are accurate enough. Where they fall short: inbound placement fees, aged inventory surcharges, and returns processing. Even Amazon’s own Revenue Calculator skips three or more fee categories introduced since 2024, despite being accurate for the fees it does cover.
The usual blind spots: inbound placement fees ($0.21-$0.68/unit), aged inventory surcharges ($0.30-$6.90/cu ft), returns processing, and low-inventory-level fees. Add those up and the gap between calculator estimate and actual fees runs $0.50-$1.50 per unit. On a product with thin margins, that gap can wipe out the profit entirely.
Conclusion
The right Amazon FBA calculator handles the cost floor. Keyword optimization raises the revenue ceiling. Together, they form the complete profitability picture.
Amazon’s free Revenue Calculator works well for quick fee checks, but it misses inbound placement fees, returns processing, and aged inventory surcharges. Paid tools like Helium 10 and SellerApp fill the gap with ASIN lookup and multi-marketplace support. As the worked example showed, hidden fees can reduce a theoretical 43% margin below 30% when storage extends past Q4.
But the biggest profitability gains come not from saving $0.08 per unit on fees. They come from improving organic rank, lifting conversion rate, and reducing PPC dependency through better keyword targeting. Fee estimation answers the question “can this product be profitable?” Keyword optimization answers “how profitable can it become?”
Start with one product. Run it through Amazon’s free Revenue Calculator to set the cost floor. Then check whether the listing targets the right keywords. For the keyword optimization side, Keywords.am handles research, listing drafting, and publishing to Seller Central in one workflow.