
📑 Table of Contents
- What is the Amazon IPI score and why does it matter in 2026?
- How do stockouts destroy Amazon keyword rankings?
- What is the ranking-velocity-inventory feedback loop?
- How can keyword search volume predict inventory demand?
- What inventory formulas does every Amazon FBA seller need?
-
Advanced Inventory Formulas: Economic Order Quantity and MOQ Strategy for Amazon FBA
The reorder point, safety stock, and days of supply formulas cover reactive inventory management — they tell sellers when to reorder and how much buffer to hold. Economic Order Quantity (EOQ) answers a different question: what is the mathematically optimal order size to minimize total inventory costs?
For Amazon FBA sellers, EOQ becomes particularly relevant once a product reaches stable sales velocity. Early in a product’s lifecycle, sellers order based on minimum order quantities (MOQ) from factories. At maturity, EOQ optimization can meaningfully reduce storage costs while maintaining in-stock rates.
The Economic Order Quantity Formula
EOQ = √(2 × Annual Demand × Ordering Cost ÷ Holding Cost per Unit)
Worked example:
- Annual demand: 3,600 units (300/month × 12)
- Ordering cost (factory setup, shipping, customs): $850 per order
- FBA holding cost per unit per year: $1.87 (standard size, $0.78/cubic foot × 12 months for a 0.2 cubic foot item)
EOQ = √(2 × 3,600 × 850 ÷ 1.87) = √(6,120,000 ÷ 1.87) = √3,272,727 ≈ 1,809 units per order
This means ordering approximately 1,800 units at a time minimizes the combined cost of ordering too frequently (shipping costs) versus ordering too much (storage costs). At this velocity, that’s roughly every 6 months — which aligns with FBA’s preference for avoiding aged inventory fees that kick in at 271 days.
Adjusting EOQ for Amazon’s Restock Limits
Standard EOQ calculations don’t account for Amazon’s ASIN-level restock caps, which limit FBA shipments to a 90-day supply for accounts with IPI scores below 400. Sellers in the penalty zone must use a modified formula:
FBA-Adjusted EOQ = MIN(Standard EOQ, 90-Day Supply Cap)
Where 90-Day Supply Cap = Average Daily Sales × 90
At 10 units per day, the 90-day cap is 900 units — regardless of what standard EOQ suggests. Sellers hitting restock caps should prioritize IPI improvement (reducing excess inventory, increasing sell-through on slow-moving ASINs) before optimizing EOQ for their hero products.
Minimum Order Quantity Negotiation Strategy
Factory MOQs frequently conflict with optimal inventory economics. A supplier requiring 2,000 units as a minimum order may create a storage burden for a product selling 20 units per day — that’s 100 days of supply, pushing into aged inventory risk during Q4 when storage fees triple.
Three MOQ negotiation levers that work for most Amazon-focused manufacturers:
- Forecast sharing: Providing factories with 6–12 month demand projections (using keyword search volume trends as a leading indicator) enables them to plan raw material purchases in advance, which is the primary reason MOQs exist in the first place.
- Blanket purchase orders: Commit to a full-year quantity but request staggered delivery in smaller shipments. Factories get production certainty; sellers avoid FBA overstocking penalties.
- SKU consolidation: If multiple product variations share components (packaging, hardware, raw materials), combining orders across SKUs often meets factory MOQs without requiring excess inventory of any single variation.
Multi-Channel Inventory Allocation: FBA vs. FBM Buffer Strategy
Sellers running both Fulfilled by Amazon (FBA) and Fulfilled by Merchant (FBM) have a stockout protection mechanism that FBA-only sellers lack. When FBA inventory runs critically low, activating FBM listings maintains the product’s availability and preserves keyword rankings during the restocking window.
The FBM buffer strategy works as follows:
- Maintain a small quantity of inventory at a third-party logistics (3PL) warehouse or home warehouse at all times
- Create a parallel FBM listing at a slight price premium (to account for higher shipping costs and protect margin)
- When FBA inventory drops below 14 days of supply, activate the FBM listing
- Amazon continues showing the product in search results; keyword rankings are preserved even during the FBA restocking gap
The cost of maintaining a 200-unit FBM buffer at a 3PL ($150–300/month in storage) is far lower than the PPC recovery spend required after a full stockout drops rankings. For hero ASINs generating $10,000+ per month, FBM buffer protection is one of the highest-ROI insurance decisions available to FBA sellers.
The Inventory Health Dashboard: 5 Metrics to Monitor Weekly
MetricWhere to Find ItAction ThresholdDays of SupplyFBA Inventory dashboardBelow 30 days → accelerate restockIPI ScoreInventory Performance dashboardBelow 450 → review excess inventorySell-Through RateFBA Inventory Health reportBelow 3 → evaluate price cuts or removalExcess UnitsFBA Inventory Health reportMore than 90-day supply → create removal or liquidation orderStranded InventoryFix Stranded Inventory pageAny amount → immediate fix requiredConnecting these metrics to keyword rank tracking data creates the early-warning system described earlier in this guide. When daily sales velocity on a hero ASIN slips below the 14-day trailing average, keyword rank monitoring often shows the decline 3–7 days earlier — validating the restock decision with demand signals before the inventory dashboard catches up.
Frequently Asked Questions About Amazon Inventory Management
- Conclusion
⚡ TL;DR
- Stockouts tank rankings fast. Organic positions drop within 48 to 72 hours of going out of stock.
- Recovery is expensive. Reclaiming keyword rankings takes 2 to 4 weeks of aggressive ad spending.
- IPI score below 400 means penalties. Amazon restricts storage and caps restocking immediately.
- Keyword data leads sales data. Search volume shifts 2 to 4 weeks before order velocity changes.
- Add FBA receiving time to lead time. Reorder formulas must account for 7 to 21 extra days.
- The feedback loop connects it all. Keyword data can serve as an inventory early-warning system.
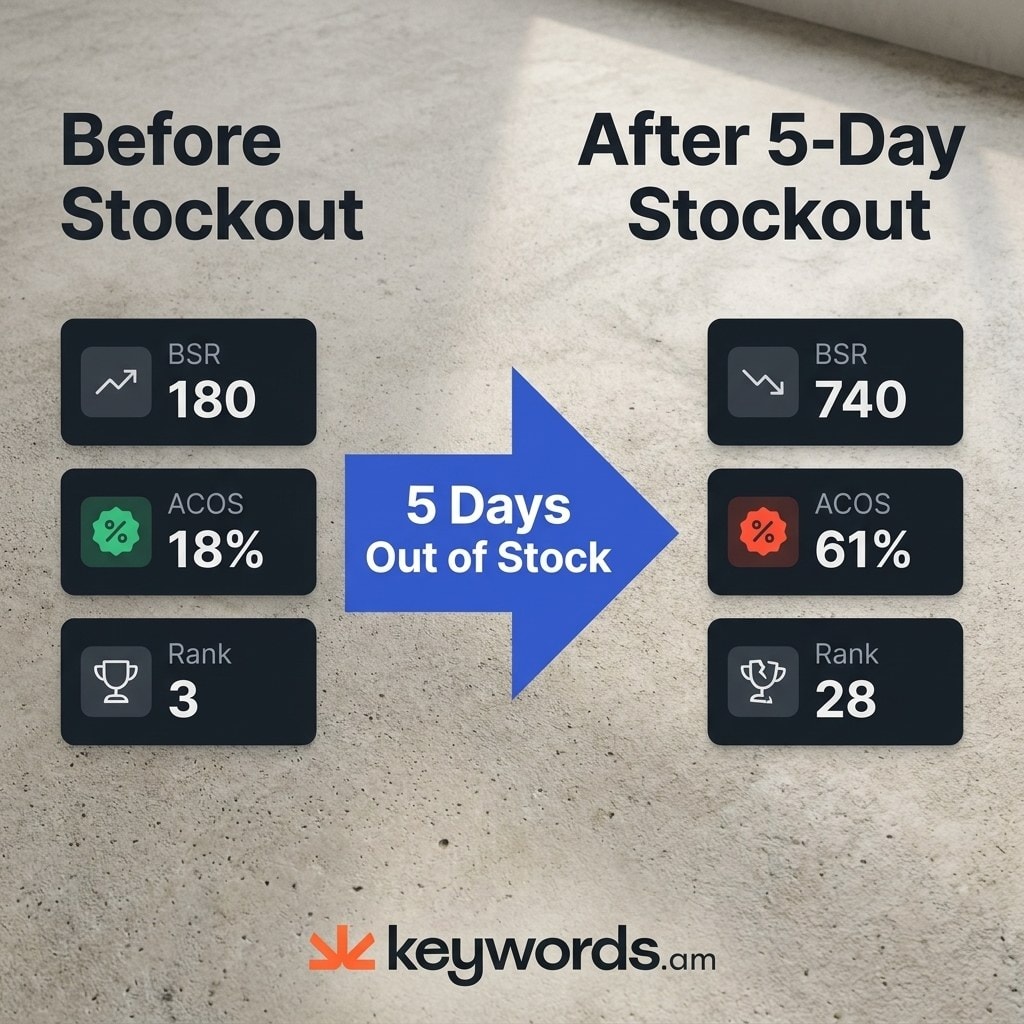
A 3-day stockout does not just cost 3 days of sales. One seller saw Best Sellers Rank drop from #180 to #740 during a 5-day stockout. Advertising Cost of Sales jumped from 18% to 61%. The total financial damage? Three to four times the direct lost revenue, most of it from ranking recovery.
Every existing amazon inventory management guide treats stock as a pure logistics problem. Lead times, warehouse fees, reorder formulas. But zero articles quantify the keyword ranking cost of running out of inventory. This is the gap.
This article connects amazon inventory management to keyword ranking protection. The formulas, the IPI benchmarks, and a feedback loop framework that uses keyword data as an early-warning system for stockouts.
What is the Amazon IPI score and why does it matter in 2026?
The Amazon IPI score is a 0-1000 metric measuring inventory health across four factors. Scores below 400 trigger storage limits and ASIN-level restock caps.
Amazon uses the Inventory Performance Index to evaluate how efficiently sellers manage their stock. This single number dictates warehouse access. A healthy score keeps operations running. A poor score creates immediate logistical problems.
Getting the fundamentals right on this metric is the foundation of solid amazon inventory management. The score breaks down into four categories:
|
IPI Factor |
What It Measures |
|---|---|
|
Excess inventory % |
Profitability drag from overstocked items with low demand |
|
Sell-through rate |
Velocity of units sold versus units held in fulfillment centers |
|
Stranded inventory % |
Unsellable units sitting in warehouses incurring fees |
|
In-stock rate |
Ability to keep popular replenishable items available for buyers |
Amazon shifted from quarterly checkpoints to continuous enforcement. Restrictions apply immediately when a score drops into the danger zone. The 13-week rolling period updates every Monday (SellerApp).
|
Score Range |
Status |
Consequences |
|---|---|---|
|
Below 400 |
Penalty Zone |
Storage capacity limits, ASIN-level restock caps, strict inbound blocks |
|
400-500 |
At Risk |
Standard storage access, vulnerable to seasonal threshold changes |
|
550-600+ |
Target Range |
Healthy inventory access, buffer against seasonal swings |
|
700+ |
Excellent |
Optimal warehouse access and lowest risk of storage penalties |
When an account falls below the minimum threshold, Amazon applies severe penalties. Storage capacity gets restricted. ASIN-level restock caps limit incoming shipments to a 90-day supply per SKU. The platform also applies a Storage Utilization Surcharge of up to $10 per cubic foot (Canopy Management). For a detailed breakdown, see this guide to Amazon FBA fees.
A healthy IPI score keeps storage access open. But there’s a cost to stockouts that no IPI dashboard captures.
How do stockouts destroy Amazon keyword rankings?
Stockouts cause organic keyword positions to drop within 48-72 hours, with full recovery taking 2-4 weeks and requiring aggressive PPC spending to reclaim lost positions.
The logistical impact of zero inventory is obvious. The algorithm impact is hidden and far more damaging. When a product becomes unavailable, Amazon immediately begins testing competing products in those search positions. The marketplace prioritizes items that can ship today.
One case study from Advertising Spire illustrates this damage clearly. During a 5-day stockout, a seller watched BSR drop from #180 to #740. ACOS inflated from a profitable 18% to a margin-crushing 61%. Amazon BSR directly correlates with search visibility, and losing ground here takes significant effort to recover.
Rankings don’t magically return when inventory arrives. The algorithm requires proof of sustained conversion velocity before restoring previous positions. When Amazon sales are dropping, that’s often a symptom. The ranking loss already happened days earlier.
Recovery timelines vary by category competitiveness:
- Standard categories: 2 to 4 weeks of sustained PPC effort to return to original rank
- Highly competitive niches (500+ competing ASINs): 4 to 6 weeks, sometimes longer
- Some products never fully recover if competitors fill the gap permanently
The financial cost adds up fast. For a product spending $50 per day on ads:
- $250 in wasted spend during the initial rank loss
- $300 to $500 in expensive recovery bids to force visibility back
- $750 to $1,200 in lost organic revenue while climbing back up
- Total cost: 3 to 4x the value of direct lost sales
An EcomCrew study tracked five ASINs through stockouts. Four recovered within four weeks. One product never recovered its historical rank. In ultra-competitive categories, the damage from stockouts can be permanent.
Multi-ASIN sellers face unique risk here. A stockout on a hero ASIN shifts ranking equity to competitors. Those competitors gain review velocity and conversion data during the gap. Unseating them later costs far more than preventing the stockout in the first place.
Rankings drive velocity, velocity informs restocking, and stockouts break the entire chain. This creates a feedback loop most sellers never see.
What is the ranking-velocity-inventory feedback loop?
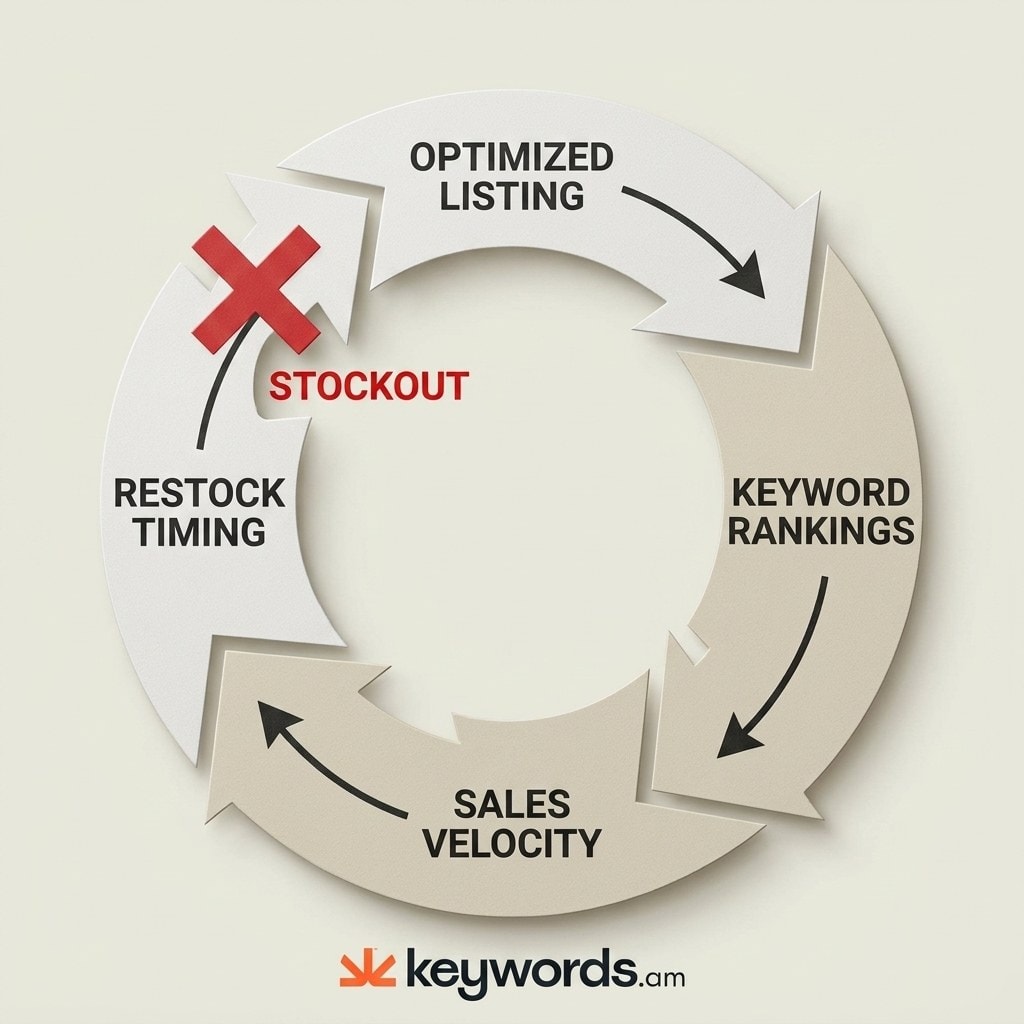
The feedback loop connects four stages: optimized listing drives rankings, rankings drive sales velocity, velocity informs restock timing, and a stockout breaks the entire cycle.
Amazon inventory management and keyword rankings are not separate problems. They operate in a continuous cycle. Managing stock on a spreadsheet while monitoring rankings on a separate dashboard creates a blind spot. Connecting these elements is the core of effective fba inventory management.
Each stage feeds directly into the next:
Stage 1: Optimized listing. The TFSD Framework establishes the foundation: titles, features, search terms, and descriptions. Precise keyword targeting leads directly to indexing and ranking.
Stage 2: Keyword rankings. Organic positions dictate click-through volume. High rankings generate consistent traffic that converts into sales. The Amazon conversion rate turns visibility into sustained daily order volume, driving BSR improvements.
Stage 3: Sales velocity. Consistent daily orders create predictable patterns. Velocity data becomes the primary restock timing signal, informing the next manufacturing run and establishing a stable amazon restock strategy.
Stage 4: The break. A stockout shatters this cycle. Rankings collapse within days, velocity drops to zero, and recovery costs compound immediately.
This framework is the key insight for modern sellers. Amazon inventory management and keyword rankings are connected through sales velocity. Managing them in isolation leads to expensive mistakes.
If keywords drive the loop, keyword data should also drive inventory decisions.
How can keyword search volume predict inventory demand?
Keyword search volume is a leading demand indicator. Rising search trends signal demand building weeks before sales velocity picks up, giving sellers time to pre-position inventory.
Historical sales data looks backward. It tells sellers what happened last month. Keyword data looks forward, showing what customers are actively searching for right now. This transforms amazon inventory planning from reactive to proactive.
Search volume data typically leads sales data by 2 to 4 weeks. Tracking “mosquito repellent” keyword volume shows search surging in March, well before actual order velocity spikes in mid-April. Sellers watching search volume ship inventory early. Sellers watching only historical sales miss the season’s start.
Monitoring keyword trends prevents the costly amazon stockout ranking impact described earlier. If keyword rankings start slipping, it often indicates a velocity problem. This signal precedes a visible sales decline by days or even weeks.
The reverse is also true. Rankings climbing fast means demand is building. Sellers should accelerate the next restock to avoid running out during growth phases. Dropping ranks, on the other hand, demand investigation into listing health or competitive shifts.
Amazon keyword rank tracker tools provide visibility into these velocity changes. Platforms like Keywords.am detect these shifts before standard inventory dashboards catch them, because keyword data moves first and sales data follows.
Seasonal keyword trends are especially powerful for amazon inventory planning. Reviewing an Amazon seasonal keyword strategy helps sellers align production schedules with annual search behavior patterns.
Keyword data tells sellers WHEN to restock. The formulas below tell them HOW MUCH.
What inventory formulas does every Amazon FBA seller need?
Every FBA seller needs three formulas: Reorder Point (demand × lead time + safety stock), Safety Stock (max scenario minus average scenario), and Days of Supply.
Guessing inventory quantities leads to expensive mistakes. Sellers need hard math behind every restock decision. These three formulas provide the foundation for amazon inventory management calculations.
Reorder Point Formula
Reorder Point = (Average Daily Sales × Lead Time in Days) + Safety Stock
Example: A product sells 15 units per day. Total lead time is 45 days. Safety stock is 300 units. The reorder point is 975 units. When warehouse stock hits 975, place the next order.
Safety Stock Formula
Safety Stock = (Max Daily Sales × Max Lead Time) − (Avg Daily Sales × Avg Lead Time)
Worked example with real numbers: A seller averages 12 daily sales with a 35-day lead time. Peak season hits 20 daily sales, and factory delays push maximum lead time to 50 days.
- Maximum scenario: 20 × 50 = 1,000 units
- Average scenario: 12 × 35 = 420 units
- Required safety stock: 580 units (eComEngine)
Days of Supply
Days of Supply = Current Inventory ÷ Average Daily Sales
This metric dictates immediate warehouse health. A critical threshold: the Low Inventory Level Fee triggers when BOTH 30-day AND 90-day historical days of supply fall below 28 days (Goat Consulting). Staying above 30 days of supply is mandatory.
The FBA Receiving Trap
The most common mistake in amazon inventory management? Calculating lead time only to Amazon’s door. The actual lead time must include Amazon’s internal receiving process, an additional 7 to 21 days before inventory becomes sellable. During Q4 or major product launch campaigns, receiving times stretch even longer.
Sell-Through Rate Benchmarks
Amazon monitors sell-through rates to determine storage limits:
|
Sell-Through Rate |
Status |
|---|---|
|
Above 7 |
Excellent. Inventory turns rapidly. |
|
3 to 7 |
Good. Healthy balance of stock and sales. |
|
1 to 2 |
Fair. Accumulating storage costs. |
|
Below 1 |
Poor. Overstocking problem, damages IPI (Assureful). |
An Amazon FBA calculator helps verify that restocking quantities make financial sense after factoring storage costs.
2026 FBA Storage Fees
|
Fee Type |
Cost |
|---|---|
|
Monthly Storage (Jan-Sep) |
$0.78 per cubic foot |
|
Monthly Storage (Oct-Dec) |
$2.40 per cubic foot |
|
Low Inventory Level Fee |
$0.32 to $0.97 per unit |
|
Aged Inventory Surcharge (271+ days) |
Starts at $5.45 per cubic foot |
These formulas handle the logistics. The FAQ below covers the most common questions.
Frequently Asked Questions About Amazon Inventory Management
These are the most common questions Amazon sellers ask about amazon inventory management, IPI scores, and stockout recovery.
Conclusion
The line between supply chain logistics and search visibility doesn’t exist anymore. Managing stock without monitoring search data invites ranking drops. Maintaining keyword positions requires disciplined execution in the warehouse.
- The feedback loop is real. Listing optimization, keyword rankings, sales velocity, and restock timing form a single connected system.
- Stockouts hit rankings in 48 to 72 hours. The damage is fast and the recovery is slow.
- Keyword search volume leads sales data. It warns sellers weeks before velocity spikes or drops become visible.
- The financial cost of a stockout is 3-4x direct lost sales. Most of that cost is PPC recovery spending.
Check keyword rankings alongside the inventory dashboard today. If any hero ASIN is below 30 days of supply and rankings are climbing, accelerate the next restock.
Keywords.am’s rank tracker monitors the search velocity data that connects amazon inventory management to keyword ranking protection. That’s the signal standard inventory dashboards miss.