Listing Optimization
Amazon product image optimization in 2026 (the best keyword strategy most sellers overlook)
Amazon product image optimization drives clicks and conversions when images connect to keyword strategy. Learn the 7-slot framework sellers use to rank higher.
Mobile-First Image Strategy: Designing for the 73% of Amazon Shoppers on Mobile
More than 73% of Amazon’s total traffic comes from mobile devices. Despite this, most Amazon sellers design product images on desktop monitors - then wonder why click-through rates underperform. A main image that looks sharp on a 27-inch monitor often becomes an unrecognizable thumbnail on a 6-inch phone screen.
Mobile-first image design isn’t just a best practice. It’s the primary variable determining whether a listing gets clicks in the search grid versus ignored.
The Thumbnail Test: The Single Most Important Image Check
Every Amazon product image should pass the thumbnail test before going live:
- Open Amazon search on a mobile device (or resize a browser window to 375px wide)
- Find the listing in search results
- The product must be immediately recognizable at thumbnail size
- The product must be visually distinct from the 3 closest competitors in the grid
Products failing this test lose clicks to better-optimized competitors before the buyer even considers the title or price. No amount of listing copy optimization compensates for a main image that disappears at mobile size.
Mobile Image Specifications That Actually Matter
| Element | Desktop Standard | Mobile-First Standard |
|---|---|---|
| Product fill | 85% of frame | 90%+ of frame (more aggressive fill) |
| Background | Pure white | Pure white with slightly stronger shadows for depth |
| Product angle | Front-facing traditional | Slightly angled (45°) for 3D perception at small sizes |
| Minimum detail | Readable fine print | No fine print - only primary silhouette reads at 100px |
| Color contrast | Product-accurate | Maximize contrast against white; avoid light-colored products on white |
Secondary Image Design for Mobile: The 3-Callout Rule
Infographic images that work on desktop routinely fail on mobile. A common mistake: placing 6–8 text callouts across an image. At mobile screen resolution, callouts crowd together and become unreadable - buyers skip past the image without absorbing any information.
The 3-callout rule for mobile-first infographic design:
- Maximum 3 callouts per image on secondary slides
- Minimum 32pt font for callout text (not 30pt as commonly recommended)
- High-contrast text boxes with solid backgrounds behind text, not text directly on image
- Icons or visual markers at 80px minimum size so they read clearly on small screens
Sellers who follow this rule and then check their secondary images on an actual phone before publishing report 20–35% higher engagement on image scroll metrics in Brand Analytics.
Video Content as the 8th Image Slot
Amazon allows one video per listing in addition to the 7 image slots. Most sellers leave this slot empty. For mobile shoppers - who make purchase decisions faster and with less reading - video is the highest-converting content element available.
Effective product videos for Amazon follow a specific structure optimized for mobile attention spans:
- 0–3 seconds: Product in use solving the primary problem (no brand intro, no logo animation)
- 3–15 seconds: Key features shown visually (not described verbally - many mobile users watch without sound)
- 15–30 seconds: Social proof or results - before/after, customer testimonial, or measurable outcome
- 30–60 seconds: Extended lifestyle and packaging detail (for buyers who watch through)
Videos should include burned-in captions - Amazon’s mobile app doesn’t auto-play audio. Videos without text are effectively silent for the majority of mobile viewers.
A/B Testing Images with Manage Your Experiments
Brand-registered sellers have access to Manage Your Experiments (MYE), Amazon’s native A/B testing tool for main images and A+ content. Running image experiments correctly requires understanding what MYE measures and how to interpret results:
- Test duration: Run experiments for minimum 4 weeks. Amazon’s algorithm requires sufficient data volume to achieve statistical significance. Ending tests early produces unreliable results.
- What to test first: Main image variations produce the largest measurable impact because CTR differences compound across every search impression the listing receives.
- Metric priority: Watch Unit Session Percentage (conversion rate) alongside sessions. A variant generating more sessions but lower USP may hurt overall revenue despite higher traffic.
- One variable at a time: Testing a new angle AND new background simultaneously makes it impossible to identify which change drove the result. Isolate variables.
The Keywords.am ASIN audit surfaces CTR and conversion benchmarks by category, giving sellers a data baseline before launching image experiments. Knowing whether a listing’s CTR is already above or below category average determines how aggressively to prioritize main image testing.
AI-Generated Images: What Amazon Allows in 2026
Amazon updated its AI-generated content policy in 2024 and 2025. In 2026, the rules are:
- Main image: Must show the actual physical product on white background - AI-generated main images are not permitted
- Secondary images (slots 2–7): AI-generated lifestyle backgrounds are permitted if they accurately represent the product in a realistic context
- Infographic overlays: AI-generated design elements are permitted for text layout, graphic composition, and background design
- A+ content modules: AI-generated imagery is permitted in supplementary modules, subject to Amazon’s general authenticity standards
Sellers using AI-generated lifestyle images report 40–60% cost reduction in content production compared to professional lifestyle photography, with comparable conversion performance when the product itself is photographed accurately and the AI-generated background is contextually appropriate.
Frequently Asked Questions About Amazon Product Image Optimization 10. Conclusion
Three out of four Amazon shoppers say product images drive their purchase decisions. Despite that, most sellers treat images as a photography exercise disconnected from their keyword strategy.
They’ll spend hours optimizing titles, bullets, and backend keywords but leave their images unconnected to the same search terms driving traffic. This gap costs sales. A listing can have stunning professional photography and still fail to address the specific objections buyers are typing into the search bar.
This guide connects amazon product image optimization to keyword research. It covers requirements, the 7-slot sequencing framework, and the hidden keyword real estate in A+ content images. Most guides teach camera settings. This one teaches how images serve the same keyword strategy as every other listing element.
What are Amazon’s product image requirements in 2026?
Amazon requires product images to be at least 1600 pixels on the longest side, use JPEG/PNG/TIFF format, and show the product on a pure white background for the main image.
Meeting the basic technical specifications keeps a listing active. The main image carries the strictest rules. The product must fill 85% or more of the frame. Sellers can’t include text, graphics, logos, or badges. The background must be pure white (RGB 255,255,255). Violating these core rules causes immediate listing suppression. A suppressed listing stops generating sales instantly, which is why Amazon’s official image requirements should be the first stop for any new product launch.
Secondary images offer creative freedom. Sellers can use lifestyle shots, infographics, comparison charts, and text overlays in slots two through seven. These slots allow brands to communicate value visually.
| Requirement | Specification | Why It Matters |
|---|---|---|
| Minimum dimensions | 1600 x 1600 px (longest side) | Enables zoom function |
| Preferred dimensions | 2000 x 2000 px | Sharper zoom on mobile |
| File formats | JPEG, PNG, TIFF, GIF (non-animated) | JPEG recommended for file size |
| Main image background | Pure white (RGB 255,255,255) | Mandatory for search results |
| Product fill | 85%+ of image frame | Maximum visibility in grid |
| Max file size | 10 MB per image | Larger files slow loading |
| Color mode | sRGB or CMYK | sRGB for web display |
| Max image slots | 7 images + 1 video | All 7 should be used |
| Main image restrictions | No text, logos, badges, watermarks | Causes suppression |
| Alt text (A+) | Available in A+ Content modules | Keyword placement opportunity |
Meeting these specs is table stakes. The question is what goes INTO each image slot.
How do Amazon product images affect search ranking?
Images affect ranking by improving click-through rate, which drives more sessions, which boosts conversion signals, which improves organic rank.
Amazon’s A10 algorithm leans on behavioral signals to rank products. When a listing appears in search results, the main image is the primary hook. Higher click-through rates tell Amazon the product matches the query, which drives more sessions to the listing page.
Here’s where it compounds: once shoppers land on the page, secondary images convince them to buy. More conversions reinforce the product’s relevance, which pushes the listing higher for that keyword. It’s a self-reinforcing cycle. Any listing optimization strategy that ignores this behavioral loop is leaving rank on the table.
The numbers back this up. YES Bar ran an A/B test on their main image through PickFu and the winning variation drove a 12% traffic lift - $3,390 in additional revenue over two weeks and a 133% sales increase. One image change. That’s the leverage at stake.
Amazon Rufus AI adds another layer to this dynamic. Rufus analyzes image content to generate product recommendations and answer buyer questions. Visual content now directly informs Amazon’s AI understanding of the product. Sellers can use category-average CTR data from Seller Central’s Business Reports to benchmark their performance and identify where amazon product image optimization efforts should focus first.
What should go in each of the 7 Amazon image slots?
The 7 slots follow a strategic sequence: main product shot, scale context, features infographic, lifestyle, comparison, packaging, and social proof.
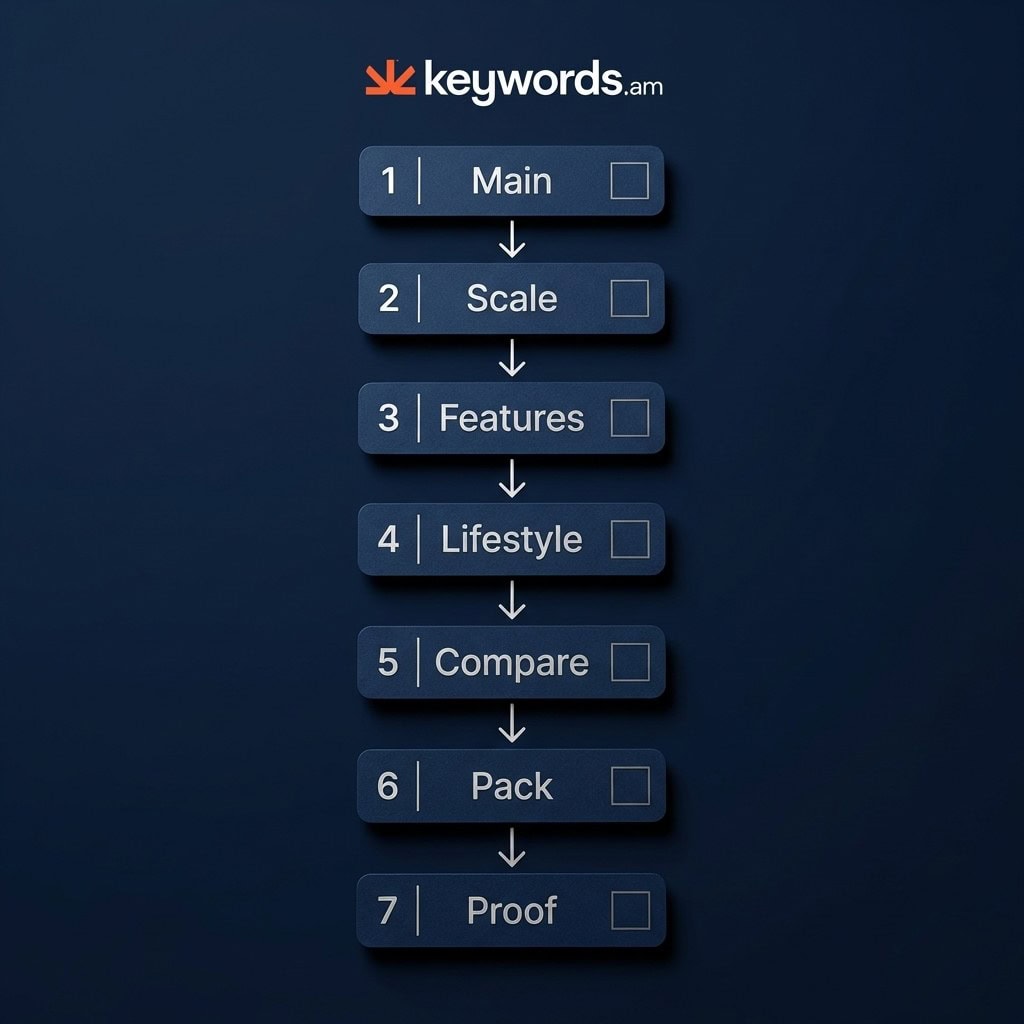
The sequence guides the buyer through a logical evaluation process:
Slot 1: Main product on pure white (the click-earner). This is the only image shoppers see in search results. Clarity and product fill are critical here.
Slot 2: Scale and size context (the expectation setter). Show the product in hand, next to a common object, or with labeled dimensions. This prevents negative reviews about unexpected sizing.
Slot 3: Key features infographic (the keyword carrier). Text overlays on this image should echo the target terms from the TFSD framework guide. The infographic acts as a visual layer of the keyword strategy.
Slot 4: Lifestyle or in-use shot (the imagination trigger). Show the product solving the exact problem the target customer faces.
Slot 5: Comparison or before/after (the objection handler). Address the primary buyer hesitation identified during keyword research.
Slot 6: Packaging or what ‘s included (the trust builder). Set accurate expectations and reduce return rates.
Slot 7: Social proof or certifications (the confidence closer). Reviews, awards, or technical certifications. This is the last image before the buy decision.
The main image deserves special attention because it’s the only one shoppers see before clicking.
How do sellers optimize the Amazon main image for higher CTR?
Maximize product fill to 85-90%, ensure sharp zoom detail, choose differentiating angles, and A/B test variations with Manage Your Experiments.
Product fill percentage controls visibility on small screens. The product should dominate the frame - 85-90% of the available space. A tiny product swimming in white will lose the click to a competitor whose product looks bigger and more substantial every time. This visual impact, combined with product title optimization, creates the first impression that earns or loses the click.
Color psychology matters more than most sellers realize. Products with contrasting colors against white backgrounds consistently pull higher CTR in crowded search grids. Angle selection is another quick win. Pull up page one for the target keyword and look at what everyone else is doing. If every competitor shows a front view, try a 45-degree angle. Differentiation grabs attention.
A/B testing removes the guesswork. Brand-registered sellers can use the free Manage Your Experiments feature to test different main images and let data declare the winner. For an immediate check, try the shelf test: shrink the main image to thumbnail size on a monitor. If the product becomes unrecognizable, the image requires resizing and cropping.
Once the main image earns the click, infographic images do the selling.
How do infographic images connect to keyword strategy?
Use text overlays that match exact search terms from keyword research, turning each callout into a visual keyword reinforcement.
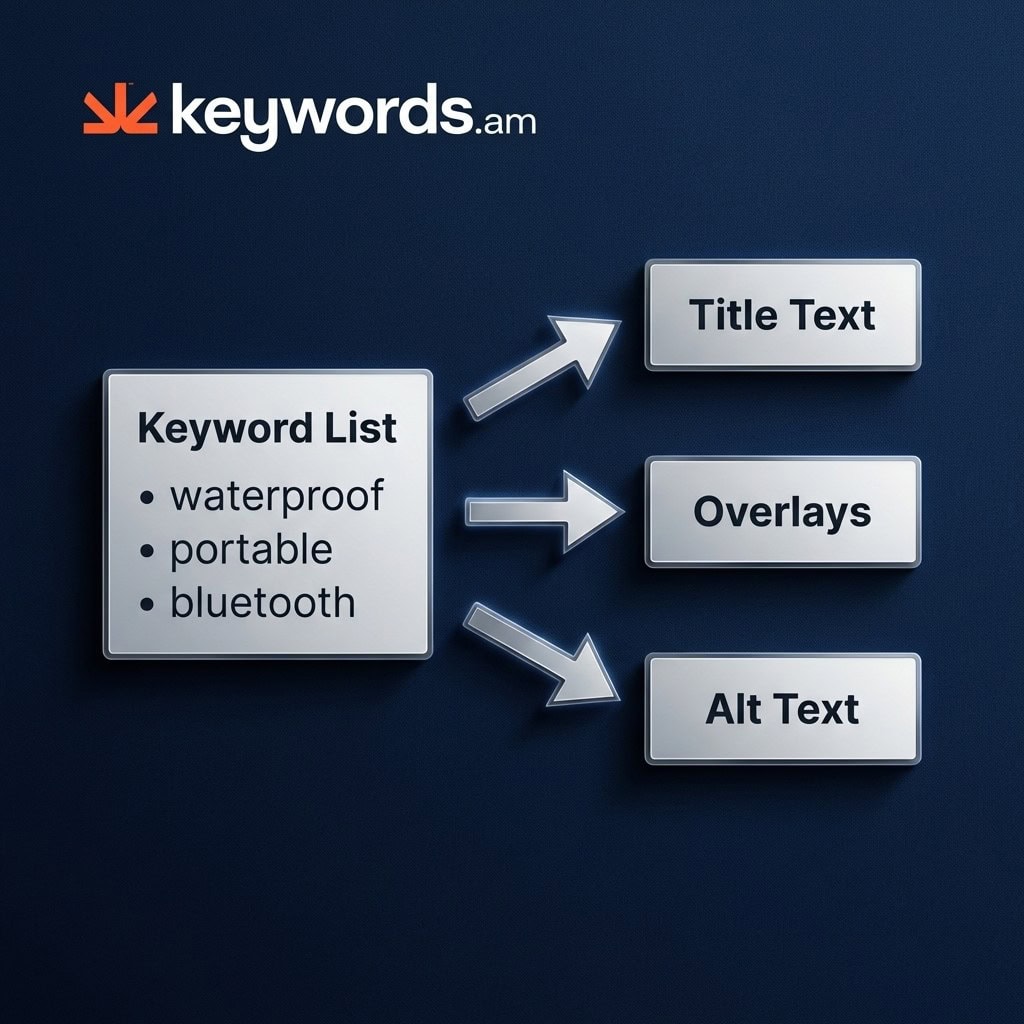
The text overlays need to use the exact phrases identified during TFSD research. If “waterproof bluetooth speaker” is a primary target keyword, the infographic callout should say “Waterproof” - not “Water Resistant,” not “Splash Proof.” Those alternatives create a disconnect between what the buyer searched and what the image confirms. Match the search language. Following the TFSD framework guide ensures visual assets align with the terms that actually drive traffic.
Each text box on an infographic is a chance to reinforce a secondary keyword. Think about a dog bed listing: callouts like “Orthopedic Memory Foam” and “Machine Washable Cover” don’t just describe features - they address specific search variations directly in the image. Best listing optimization tools can surface which secondary terms deserve that visual placement.
Comparison charts in image format can tackle “vs” keywords visually - a graphic comparing a “bluetooth speaker vs wired” directly answers comparison search intent without words. But design matters: over 70% of Amazon traffic comes from mobile devices. If the text on an infographic isn’t readable at phone screen size, it’s wasted real estate. Stick to 30pt font minimum, high contrast, and three to five callouts max per image.
This connection between keyword research and image design is what separates strategic amazon product image optimization from basic product photography.
How does A+ content image alt text extend keyword indexing?
A+ alt text fields let sellers place keywords that don’t fit in titles or bullets, expanding the listing’s keyword footprint.
Every A+ Content module includes a backend image alt text field. Amazon’s systems can read these fields. Amazon hasn’t publicly confirmed that alt text directly influences A10 ranking - but the fields are crawlable, and they do contribute to the listing’s overall keyword footprint. Smart sellers treat A+ content optimization as keyword real estate, not just a design exercise.
Using alt text for long-tail keywords
The play is long-tail keywords. These are terms that can’t fit within the strict 200-byte title limit or 500-byte bullet point constraints. Once sellers understand Amazon character limits, finding alternate locations for valuable keywords becomes a priority. A+ alt text is one of the best overflow locations available.
Text overlays in Enhanced Brand Content
Enhanced Brand Content text overlays work the same way. The visible text baked into A+ image modules should map to target keywords. Terms that score high on relevance but don’t justify placement in the main title or features? They belong in A+ image alt text and visual overlays.
The TFSD framework guide identifies these overflow keywords, ensuring no valuable search terms are discarded simply due to space constraints. This approach transforms amazon product image optimization from a visual exercise into a comprehensive keyword coverage strategy.
How should sellers audit their Amazon listing images?
Check compliance with Amazon requirements, evaluate each slot, test main image CTR, and verify infographic text matches current keywords.
Image compliance checklist
The audit begins with technical verification:
- Dimensions: Every image meets the 1600px minimum (2000px preferred)
- File size: Under 10 MB per image
- Main image rules: White background, no text/logos/badges, 85%+ product fill
- Suppression triggers: No watermarks, no promotional text, no lifestyle elements on the main image
A proactive Amazon listing audit tool automates much of this verification and ensures listings remain active and visible.
Keyword alignment check
Look at the infographic callouts. Do they still match current target keywords? Search trends shift with seasons and competitor moves. The text on images should evolve alongside the keyword strategy - stale callouts are missed opportunities.
Check session rate and conversion rate in Seller Central’s Business Reports. These are the ground truth metrics for image effectiveness. Low sessions? The main image isn’t earning clicks. Low conversion? The secondary images aren’t persuading shoppers to buy.
Reshoot vs. redesign
Here’s a decision most sellers overthink: reshoot or redesign? If the physical product hasn’t changed, updating infographic overlays with current keywords is faster and cheaper than booking a new photo shoot. This iterative approach belongs in every listing optimization checklist.
The Keywords.am ASIN audit report flags image compliance issues as part of the overall listing health score, providing a clear starting point for amazon product image optimization efforts.
How does image optimization drive keyword ranking velocity?
Image optimization accelerates keyword ranking by creating a self-reinforcing loop: better main images increase click-through rate, higher CTR drives more sessions, and stronger conversion signals from secondary images compound into faster organic rank improvement.
Most sellers treat keyword optimization and image optimization as parallel workstreams. In practice, they’re tightly coupled. A listing’s organic ranking velocity depends on behavioral signals - how many shoppers click and how many buy - and images control both.
The CTR-to-rank compounding effect
When a main image improvement increases click-through rate by 10–15%, the listing receives more sessions for the same search terms. Amazon’s A10 algorithm interprets higher CTR as a stronger relevance signal, which pushes the listing higher in organic results. Higher position generates more clicks, creating a compounding effect that accelerates ranking gains across target keywords. This is why Amazon long-tail keyword targeting and image optimization should be synchronized - adding new long-tail keywords to a listing while simultaneously improving image CTR compounds the ranking velocity effect on multiple terms at once.
Conversion depth and keyword tenure
Amazon’s algorithm doesn’t just measure whether buyers click - it measures whether they buy. Secondary images that systematically address buyer objections (size context, feature callouts, lifestyle use cases, social proof) keep conversion rates high as more traffic flows in. Sustained conversion on a keyword signals to Amazon that the listing reliably satisfies that specific search intent, which stabilizes and improves ranking position. A listing that earns clicks but fails to convert is actively penalized - images that mislead about product features or fail to answer the buyer’s core question cause exactly this pattern.
What to fix first: CTR or conversion?
If sessions are low relative to ad spend, the main image is the bottleneck - fix CTR first. If sessions are adequate but Unit Session Percentage is weak, secondary images are failing to persuade. Use the Amazon sales diagnostic framework to separate these two causes before spending budget on new photography. The session versus conversion split is the fastest way to identify whether the main image or the secondary image sequence needs work.
Infographic text as keyword reinforcement
Text overlays on infographic images should echo the primary and secondary keywords driving traffic to the listing. When a buyer searches “orthopedic dog bed memory foam washable cover” and the infographic callouts confirm “Orthopedic Memory Foam” and “Machine Washable Cover,” the visual content reinforces the keyword-to-intent match. This alignment between search language and image language contributes to higher conversion, which in turn strengthens keyword ranking. The complete workflow - from long-tail keyword research to image content strategy - operates as a unified ranking system when each element reinforces the others.
Frequently Asked Questions About Amazon Product Image Optimization
These are the most common questions sellers ask about amazon product image optimization.
Do Amazon product images affect search ranking?
Yes. Images influence click-through rate and conversion rate, both behavioral signals that Amazon’s A10 algorithm uses to determine organic ranking. Better images lead to more clicks, which lead to higher rank.
What size should Amazon product images be?
Amazon requires at least 1600 pixels on the longest side to enable zoom. The recommended size is 2000 x 2000 pixels for sharp display across desktop and mobile devices.
How many images should an Amazon listing have?
Amazon allows 7 images plus 1 video per listing. Sellers should use all 7 slots because each image addresses a different buyer concern and collectively they reduce purchase hesitation.
Can sellers use AI-generated images on Amazon?
Amazon allows AI-generated lifestyle and infographic images for secondary slots. Main images must show the actual product photographed on a white background. AI-generated images in secondary slots must be clearly realistic and not mislead buyers about the product.
What is the best Amazon product image sequence?
The most effective sequence is: main product shot (slot 1), size context (slot 2), key features infographic (slot 3), lifestyle usage (slot 4), comparison or before/after (slot 5), packaging contents (slot 6), and social proof (slot 7).
Conclusion
Amazon product images are a keyword strategy problem dressed up as a photography problem. Treating them as a visual exercise alone means missing the chance to communicate directly with search algorithms and buyer intent.
- The 7-slot framework transforms random product photos into a sequenced sales argument.
- Infographic overlays visually reinforce the specific search terms driving traffic to the listing.
- A+ content alt text provides hidden fields to expand a listing’s keyword footprint without cluttering visible text.
- Main image optimization directly influences the click-through rate required to trigger Amazon’s ranking algorithm.
Audit the infographic text overlays on a best-selling listing today. Check if the callouts match current target keywords from recent TFSD research. Updating a few text overlays is often the fastest path to improved conversion. Use an Amazon listing audit tool to verify image compliance and identify immediate opportunities for optimization.