KPS is Live: Meet the Keywords.am Priority Score
We just shipped something we have wanted for a long time. KPS is now live in production inside Keywords.am. KPS stands for Keywords.am Priority Score. It is the simplest way we know to answer the question every Amazon seller asks, usually under pressure, usually with too little time… “Which keywords should I focus on first to actually move the needle?” Most tools give you a giant list. Some give you volume. Some give you a relevance number. Some give you a score that feels random and hard to trust. KPS is different. It is a decision system. It starts with Amazon Brand Registry Search Query Performance data, turns it into a clean unified view, and ranks keywords based on how likely they are to create meaningful listing impact. Not noise. Not vanity. Impact.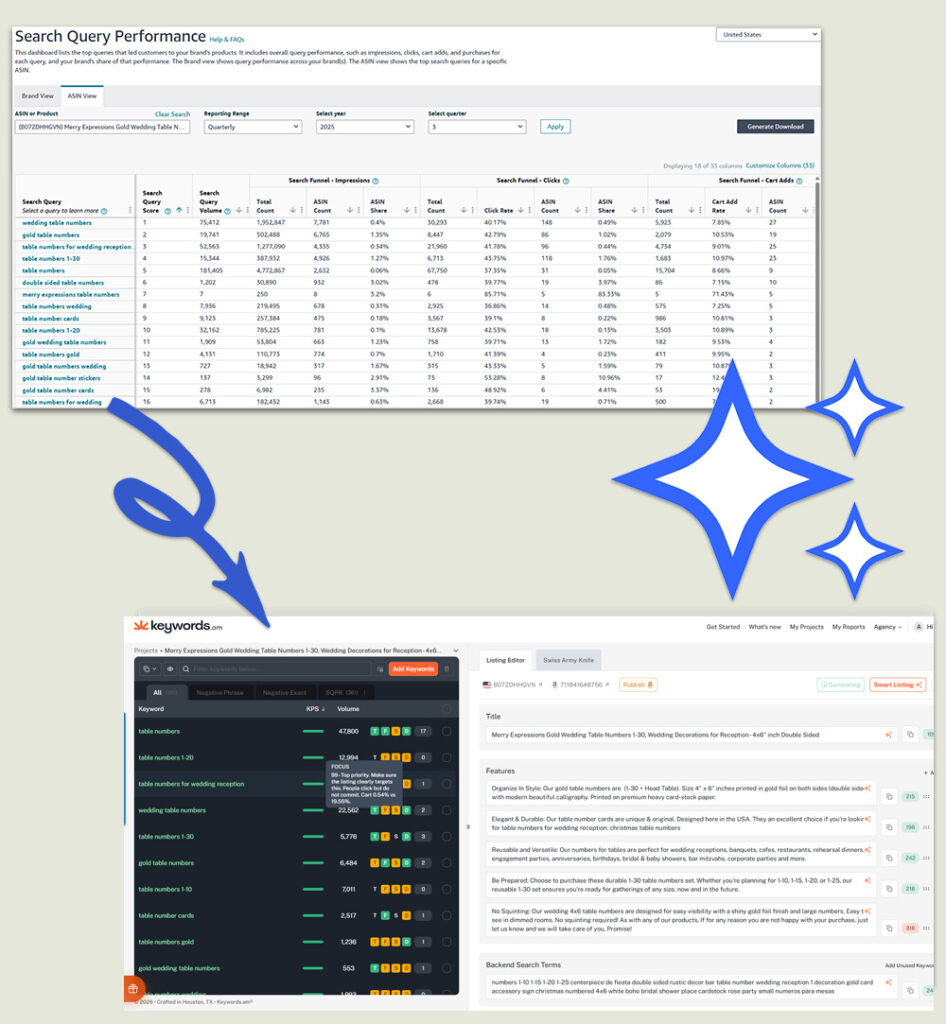
The real win: turning Amazon’s ugly reports into clear actions
If you have ever downloaded Amazon reports, you know what it feels like… Huge spreadsheets. Confusing columns. Metrics that look important but do not tell you what to do next. Search Query Performance dashboards that give you data, but not decisions. This is exactly what we built KPS to solve. Keywords.am takes the messy, complex data Amazon gives you and turns it into a practical playbook. Instead of staring at a spreadsheet and guessing, you get:
- A clear priority score (KPS) so you know what matters first
- Annotations that explain what the data pattern means
- Practical next actions you can apply to your listing and ads right away
Data is only valuable when it changes what you do tomorrow morning. KPS is built for that.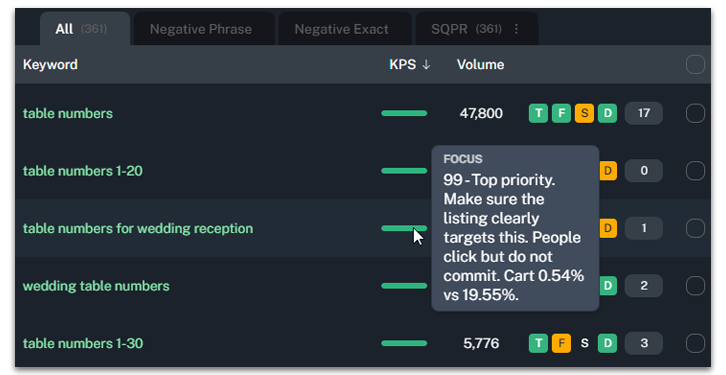
The problem KPS solves
If you have ever worked a listing seriously, you know this pain… You can find hundreds or thousands of keywords. But you only have a few places that truly matter, and only so much time.
- Title
- First bullets
- Images and A plus messaging
- Backend terms
So the real problem is not “find keywords”. The real problem is “choose the right keywords first”. That is what KPS is built for.
What KPS is
KPS is a 0 to 100 priority score that estimates keyword impact. High KPS means this keyword is worth your attention. Strengthen your listing around it and you are more likely to see meaningful traffic and sales gains. Low KPS means the keyword might still be real, but it is not where you should spend premium listing space right now. KPS is not a score that exists in a vacuum. It is tied to what Amazon is showing shoppers, and how your ASIN is performing inside that demand.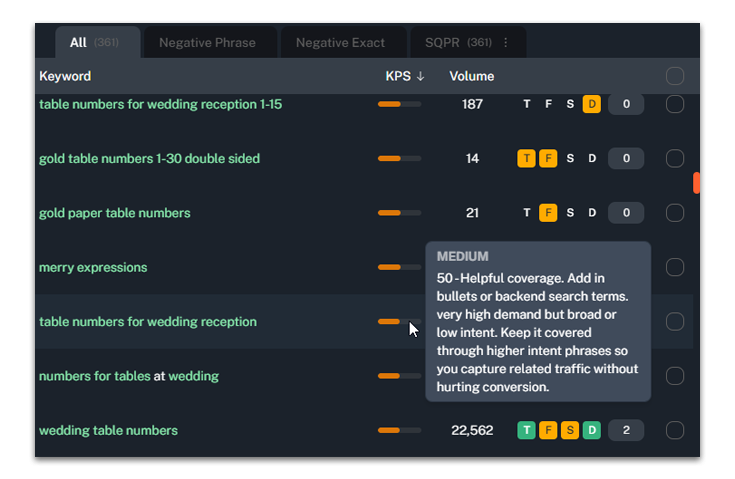
Where the data comes from
KPS is powered by Amazon’s Search Query Performance data from Brand Registry. That matters because this is not scraped guesswork. This is first party reporting that shows what shoppers actually do on Amazon across impressions, clicks, cart adds, and purchases. We take that report data and process it into a keyword model that includes signals like:
- Search demand and visibility
- Total market impressions and engagement on the query
- Your ASIN’s share of impressions, clicks, cart adds, and purchases
- Your current capture versus the available opportunity
- How stable the data is over time windows
- Whether a query looks like true shopper intent or broad browsing
Then we compress that into a single number that makes sense to a seller. That compression is the hard part. That is the value.
What KPS looks at
We do not expose the full formula. That is our secret sauce. But we do want you to understand what KPS values, because trust matters.
1. Demand
A keyword cannot move the needle if it has no demand. KPS looks for keywords with real shopper activity. Not a tiny blip. Real demand that can drive meaningful impressions.
2. Relevance
High demand does not help if the query is aligned to the wrong thing. KPS uses performance patterns and relevance signals to avoid prioritizing keywords that attract the wrong shopper.
3. Opportunity
The best keyword is often not the biggest keyword. The best keyword is the biggest keyword you are currently missing. KPS rewards keywords where market demand is high and your ASIN’s current share is low. That is where listing work can create upside.
4. Trustworthiness
Amazon data can be spiky. A keyword can look amazing because of tiny samples. KPS applies stability checks so the score is less likely to overreact to one lucky click or a one off purchase.
New: KPS Annotations (the “why” behind the score)
Starting now, KPS is not just giving you a number. We are also adding annotations that interpret the pattern behind that score. Think of it like this:
- KPS tells you what to focus on.
- Annotations tell you why it looks that way, and what to do next.
This is how we translate spreadsheet chaos into practical guidance.
Quick note on “category averages”
In Search Query Performance, the “average” you can trust is usually the market for that exact search query. In other words, compare your ASIN to the totals for the query itself, not a broad category average. Intent changes per query. “Wedding” and “wedding cake topper” might live in the same category, but they behave nothing alike.
The key rates KPS compares (simple playbook)
These are the core lenses we use to interpret what is happening inside a query.
1. Demand
Volume and total market impressions for the query.
2. Visibility
Your impression share. [code] visibilityShare = asin_impressions / total_query_impressions [/code]
Or use asin_impression_share when it is reliable.
3. CTR
Clicks per impression. [code] yourCTR = asin_clicks / asin_impressions marketCTR = total_clicks / total_query_impressions [/code]
4. Add to cart rate
Cart adds per click. [code] yourATC = asin_cart_adds / asin_clicks marketATC = total_cart_adds / total_clicks [/code]
5. Purchase conversion
Purchases per click. [code] yourCVR = asin_purchases / asin_clicks marketCVR = total_purchases / total_clicks [/code]
How to label High or Low (fast and consistent)
Annotations use a simple ratio versus the market for that exact query. [code] ratio = yourRate / marketRate [/code]
If the market rate is tiny, treat it as unknown intent and do not overreact. Tiny denominators create fake extremes.
| Ratio vs market | Label |
|---|---|
| 1.0 or more | High |
| 0.7 to under 1.0 | OK |
| 0.4 to under 0.7 | Low |
| Under 0.4 | Very low |
The rules table (the main cheat sheet)
Read this like “if you see this pattern, it usually means this, and do this next.”
| Signal pattern you see | What it usually means | What to do next |
|---|---|---|
| High demand, very low visibility share | Amazon does not see you as a match yet | Add exact phrase in title or top bullets. Strengthen images to match use case. Run exact match ads to force learning. |
| High visibility, CTR very low vs market | Shown but shoppers skip you | Main image and title are not matching shopper expectation. Fix hero image, clarity, promise, and price positioning. |
| CTR OK or high, ATC very low vs market | Clicks but low intent match or weak offer clarity | Improve offer clarity: what is included, size, quantity, compatibility, variations. Reduce confusion above the fold. |
| ATC OK or high, CVR very low vs market | They like it, but do not buy | Usually price, shipping, reviews, trust, or mismatch late in funnel. Improve proof, price framing, delivery, and objection handling. |
| High demand, low share, but CTR and ATC strong | Great keyword, you are underexposed | Focus. Improve relevance placement, then scale ads and ranking pushes. This is a growth term. |
| High demand, high share, funnel rates near market or better | You are already winning | Protect. Keep coverage stable. Do not rewrite away the phrase. Defend with ads if competitors appear. |
| Low demand, but strong funnel rates | Long tail winner | Include. Keep it covered but do not sacrifice top real estate. Use backend or secondary copy. |
| Broad one word term, high demand, low intent or low conversion market | Root term carries significance but not direct intent | Cover. Make sure it is implied by higher intent phrases. Do not let it dominate focus terms. |
| Any rate looks extreme, but your impressions or clicks are tiny | Not enough data, volatility | Hold judgment. Keep included if relevant. Get more data with ads before making big listing changes. |
New insight you can use today: Delivery Speed CVR
| Amazon is now showing clicks and purchases by delivery date. Same day, 1 day, and 2 day. Why do you care… Because you can now calculate the conversion rate difference by delivery speed. That is a clean read on how much fast shipping is helping you win. Here is a real example from a client product doing about $2m per year: Delivery speed | CVR |
|---|---|
| Same day | 33% |
| 1 day | 27% |
| 2 day | 21% |
Going from 2 day to same day is 21% to 33%. That is a 57% lift. That is the kind of lift you usually only see from dramatic price cuts or aggressive promos. So if more shoppers see same day delivery, you tend to convert higher. When you convert higher, you tend to rank higher. And when you rank higher, you make more profit.
How to check your products (10 minutes)
- Go to Brand Analytics then Search Catalog Performance.
- Adjust the columns to show clicks and purchases for all delivery times (same day, 1 day, 2 day).
- Calculate CVR by speed: purchases divided by clicks.
- Circle ASINs where 2 day has meaningful volume and materially lower CVR.
Two practical levers to pull right now
- Increase stock in FBA. Aim for 90 plus days of supply on leading ASINs.
- Split inbound shipments across five warehouses. Yes it can cost more. But if it increases same day exposure, the conversion lift can pay for it fast.
We are testing more tactics and we will share them once we see clear winners. Fast shipping is becoming a bigger ranking and conversion advantage. Use it.
How to use KPS the right way
If you already have a brand connected to Amazon
- Go to Brand Settings
- Click the Vertical ellipsis next to the brand name to Edit Brand
- Open Amazon Connection
- Under Connection Settings Make sure “Sync brand keywords” is enabled
Once your keywords are imported you will receive an email to log in to your project. Once you get in your project you can:
- Sort your keyword list by KPS.
- Start with the top set.
- Use the annotation to understand what is broken: visibility, click, consideration, or close.
- Add the highest KPS keywords in premium listing space only if they match your product truth.
- Use high KPS root terms as ingredients inside specific phrases, not as your headline.
- Do not try to optimize everything at once. Fix one bottleneck at a time.
The goal is not to have the biggest list. The goal is to build a listing that speaks the right customer language and wins the right searches.
KPS is just the beginning
We built Keywords.am because sellers should not have to choose between spreadsheets and chaos. Amazon gives you mountains of data. KPS and annotations turn that mountain into a shortlist, and that shortlist into actions. That is the point. It is live now. It is in production. And it is built to help you win faster with less guessing. If you are already using Keywords.am, open your keyword list and start with the top KPS terms today.