
📑 Table of Contents
- What is Amazon conversion rate and why do most sellers track it wrong?
- What are the average Amazon conversion rate benchmarks for 2026?
- How do you find your Amazon conversion rate in Seller Central?
- Why are keywords the real starting point for higher Amazon conversion rate?
- How does an ASIN audit reveal Amazon conversion rate problems?
- 7 best levers to improve your Amazon conversion rate
- Frequently Asked Questions About Amazon Conversion Rate
- Conclusion
⚡ TL;DR
- Amazon conversion rates average 10-15%, outperforming standard e-commerce sites by 5x.
- Sellers often conflate Unit Session Percentage with Order Session Percentage, distorting actual listing performance.
- Category benchmarks range widely, from 3% in Electronics up to 25% in Grocery.
- Keyword relevance is the true foundation for Amazon conversion rate optimization.
- Poor keyword placement attracts unqualified traffic that abandons listings without purchasing.
- ASIN audits diagnose specific coverage gaps before sellers waste time overhauling images.
- Optimizing titles, bullet points, and backend search terms captures qualified, purchase-ready shoppers.
Amazon’s average conversion rate sits between 10 and 15 percent. Compare that to the 2-3% standard across general e-commerce, and the built-in advantage becomes clear. Jungle Scout and industry reports consistently validate this traffic edge.
Yet thousands of sellers leave it on the table by tracking the wrong metric. They conflate Unit Session Percentage, PPC conversion rate, and Order Session Percentage without realizing each tells a different story. This playbook delivers 2026 Amazon conversion rate benchmarks by category and price point, explains the keyword-first flywheel behind top sellers, and provides a diagnostic approach to finding conversion leaks.
What is Amazon conversion rate and why do most sellers track it wrong?
Amazon conversion rate measures the percentage of visitors who purchase after viewing a listing, but Amazon reports three different versions that sellers frequently mix up.
Unit Session Percentage (USP) divides total units ordered by total sessions. Seller Central displays this number by default, and it can exceed 100%. A buyer adding three units of shampoo to their cart during a single session inflates the metric. This quirk creates a false sense of security for sellers pushing consumables or multi-packs.
Order Session Percentage (OSP) divides total orders by sessions. This metric caps at 100% and serves as the more accurate measure of listing conversion for most analyses. Sellers find this column inside Business Reports, but it requires manual activation. Many sellers don’t know it exists.
PPC conversion rate calculates orders from ad clicks divided by total ad clicks. This metric only measures paid traffic and ignores organic visitors. Blending PPC data with organic conversion rates produces a meaningless average that masks underlying problems.
Here’s why the distinction matters. A seller seeing a 25% Unit Session Percentage might celebrate. But if Order Session Percentage sits at 8% and PPC conversion lags at 4%, the product is losing money. Tracking the right data point is the bedrock of any successful Amazon listing optimization strategy.
What are the average Amazon conversion rate benchmarks for 2026?
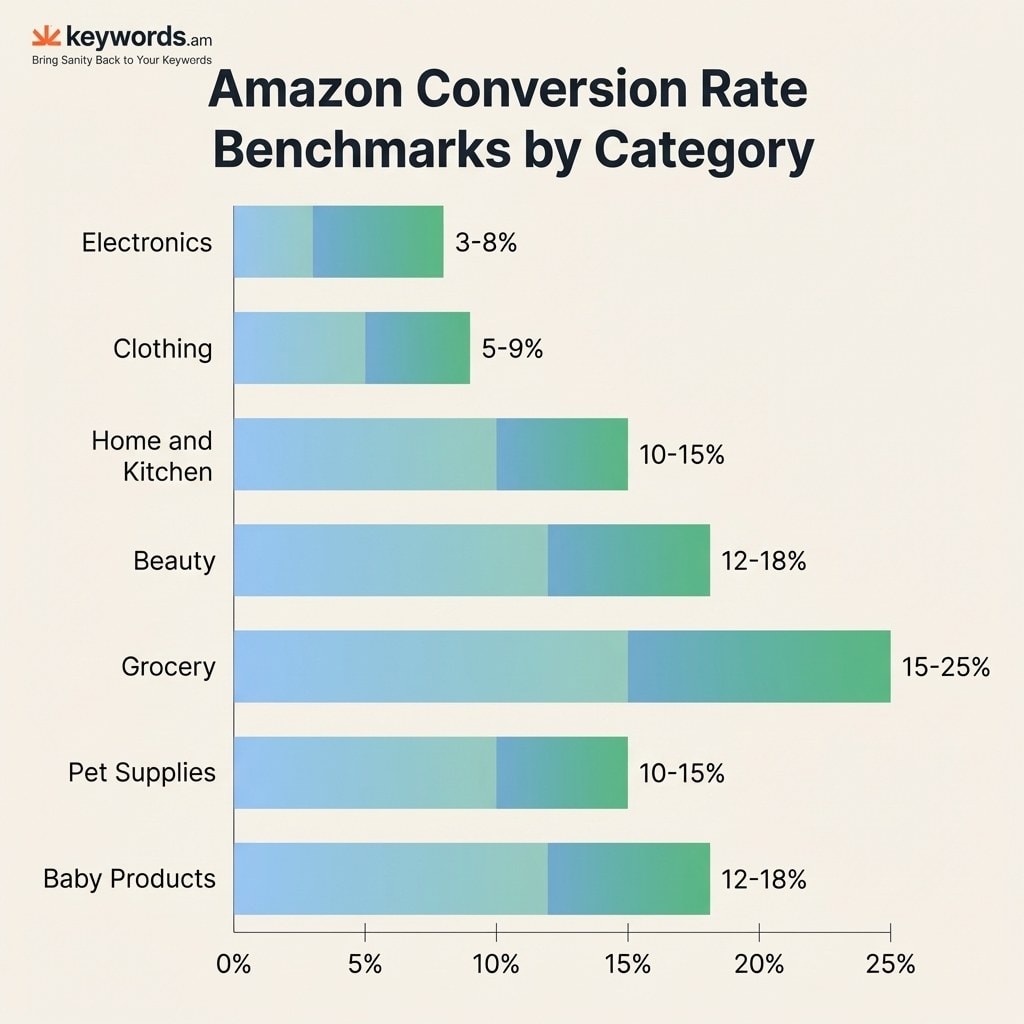
Average Amazon conversion rates range from 3% in Electronics to 25% in Grocery, varying by category, price point, and listing maturity.
Category |
Average Conversion Rate |
Top 10% Sellers |
|---|---|---|
Electronics |
3-8% |
12%+ |
Clothing & Accessories |
5-9% |
14%+ |
Home & Kitchen |
10-15% |
20%+ |
Beauty & Personal Care |
12-18% |
22%+ |
Grocery & Gourmet |
15-25% |
30%+ |
Pet Supplies |
10-15% |
18%+ |
Baby Products |
12-18% |
22%+ |
These Order Session Percentage ranges reflect aggregated industry data for 2025-2026 sourced from SellerMetrics, SellerApp, and Ecom Brainly.
Price point benchmarks
Price Range |
Expected Conversion Rate |
|---|---|
Under $20 |
15-25% |
$20-$50 |
10-15% |
$50-$100 |
6-10% |
$100-$300 |
4-8% |
Over $300 |
3-8% |
Price has a strong influence on Amazon conversion rate. Ecom Brainly’s analysis shows a clear inverse relationship: higher prices mean more comparison shopping and fewer impulse purchases. A $15 kitchen gadget converts at 20% because the risk is low. A $400 espresso machine converts at 5% because buyers read every review before clicking “Add to Cart.”
New launches vs. established listings: Fresh listings typically convert 30-50% below the category average for the first 60-90 days. Zero reviews and no sales history create friction for early buyers. Don’t compare a two-week-old item against mature benchmarks. That comparison triggers unnecessary panic.
How do you find your Amazon conversion rate in Seller Central?
Navigate to Seller Central’s Business Reports, select Detail Page Sales and Traffic by ASIN, then look at the Unit Session Percentage and Order Session Percentage columns.
- Open Seller Central and click the Reports tab.
- Select Business Reports from the dropdown menu.
- Click Detail Page Sales and Traffic by ASIN in the left sidebar.
- Locate the Unit Session Percentage and Order Session Percentage columns.
The Order Session Percentage column doesn’t appear by default for all accounts. Click the column customization selector on the right side of the report to activate it. Many sellers skip this step and never see the more accurate metric.
Use 30-day rolling windows. Daily listing performance data fluctuates from external factors: end-of-month payday cycles, competitor stockouts, seasonal shifts. A full month of data smooths out the noise and shows the real trend.
Why are keywords the real starting point for higher Amazon conversion rate?
Keywords determine who sees a listing. Wrong keywords attract unqualified visitors who browse but never buy, making downstream optimizations like images and reviews ineffective.
This flywheel: keyword relevance brings qualified traffic, which drives higher conversion, which signals the A10 algorithm to improve organic ranking, which pulls in more qualified traffic. This virtuous cycle is what separates top-10% sellers from the rest.
Nearly every competitor guide starts in the wrong place. They advise sellers to shoot better images or accumulate more reviews. Those elements matter, but they optimize the close of the sale while ignoring the opening. Starting with images before fixing keywords is like decorating a boutique in an empty neighborhood. If the wrong keyword pulls in a shopper searching for something else, professional photography won’t save the sale.
How TFSD maps keywords to conversion
The TFSD framework maps which search terms belong in the Title, Features (bullet points), Search Terms (backend), and Description. Each field carries different indexing weight and character constraints. Placing high-converting keywords in the Title captures visibility. Reinforcing them across the remaining fields builds the coverage that attracts the right shoppers. The Amazon product description guide covers how the Description field supports this structure.
Prioritizing the right keywords
Not all keywords convert equally. Search volume alone is noise. The KPS feature focuses sellers on keywords with the highest conversion contribution, not just the highest volume. Grouping these terms via Amazon keyword clustering ensures they’re deployed across the entire listing structure.
How does an ASIN audit reveal Amazon conversion rate problems?
An ASIN audit grades a listing across keyword coverage, compliance, and content completeness, revealing specific conversion leaks before sellers waste time on generic optimization.
Doctors diagnose before prescribing. Sellers should do the same. Too many jump straight to random tactics, slashing prices or commissioning new photography without identifying the actual bottleneck. An ASIN audit isolates the specific failure point: keyword gaps, policy violations, or empty fields that the algorithm penalizes. The best Amazon listing optimization tools can streamline this process.
A thorough audit exposes blind spots that tank Amazon conversion rate:
- Keyword coverage gaps reveal which relevant search terms are absent from titles and backend fields.
- Character limit compliance confirms search terms aren’t being truncated.
- Suppression risk flags spotlight policy violations that can erase a product from search results.
- Content completeness scores identify unpopulated fields that trigger quiet algorithmic penalties.
The audit output becomes a prioritized fix list. A seller might discover that 40% of their top-converting phrases are missing from the title. Fixing that single gap often moves the needle more than a full image overhaul.
7 best levers to improve your Amazon conversion rate
The seven highest-impact conversion levers are title optimization, bullet points, backend search terms, product images, A+ content, reviews and social proof, and pricing with Buy Box strategy.
-
Title optimization — The title carries the heaviest indexing weight and is the first text a shopper reads. Place the highest-converting keywords in the first 80 characters for maximum relevance.
-
Bullet points — Features reinforce keyword coverage while neutralizing buyer objections. Each bullet should answer one common pre-purchase question.
-
Backend search terms — The hidden Amazon conversion rate driver. Sellers have 249 bytes of invisible real estate for relevant terms that don’t fit naturally in visible listing copy.
-
Product images — Amazon allows up to nine images per listing. SellerApp data shows listings with 7+ images convert up to 30% better than those with 1-3 photos. The main image wins the click; infographics and lifestyle photos close the sale.
-
A+ content — Enhanced brand content adds visual storytelling below the fold. Amazon reports A+ content can increase conversion by 3-10%.
-
Reviews and social proof — Products with 15+ reviews convert 3-4x higher than products with zero reviews. Focus on product quality and professional post-purchase follow-up sequences. There are no shortcuts here.
-
Pricing and Buy Box strategy — Competitive pricing drives both conversion rate and Buy Box eligibility. Losing the Buy Box drops a seller’s effective conversion rate to near zero.
How conversion feeds ranking
A strong Amazon conversion rate signals to Amazon’s A10 algorithm that a listing satisfies shopper intent. The algorithm rewards this with better organic placement, which brings more qualified traffic. This is the flywheel in action.
Amazon Rufus and AI shopping in 2026
With 250M+ shoppers using Amazon’s Rufus AI assistant, listing completeness matters more than ever. Rufus reads the entire listing (title, bullets, description, A+ content, Q&A) to generate answers. Incomplete listings get skipped. Understanding Amazon Rufus AI listing optimization helps sellers stay visible as AI shopping grows.
Frequently Asked Questions About Amazon Conversion Rate
These are the most common questions Amazon sellers ask about conversion rate optimization.
Compare against the benchmark tables above rather than a single universal number. An Electronics product converting at 8% is strong. A Grocery item converting at 8% signals a problem.
This metric can exceed 100% when buyers purchase multiple units. Order Session Percentage caps at 100% and provides a clearer picture of actual conversion performance.
Start with a listing audit to isolate the specific problem before testing random fixes. A dedicated ASIN audit tool pinpoints the leak.
Amazon reports Prime members convert at roughly 74% on their purchases overall, though individual listing conversion still depends on category and competition.
This is exactly why keyword-first optimization matters. Qualified traffic converts, which fuels ranking improvement. Read the A10 algorithm guide for deeper algorithmic details.
Conclusion
- Track Order Session Percentage, not just Unit Session Percentage. The metric you optimize for determines the actions you take.
- Start with keyword relevance, not images or reviews. Wrong traffic never converts, regardless of listing quality.
- Diagnose before you optimize. An ASIN audit reveals specific conversion leaks instead of leaving sellers to guess.
Run a quick diagnostic on your lowest-converting listing today. Find where keyword coverage gaps are costing conversions. See where your listings leak with a free ASIN audit.