
⚡ TL;DR
- No native metric: Amazon lacks a native amazon keyword difficulty metric; scores from third-party tools borrow from Google SEO and often mislead sellers.
- Different algorithms: Google’s keyword difficulty relies on backlinks and domain authority, while Amazon’s algorithm prioritizes sales velocity and conversion.
- Five real signals: Real Amazon keyword competition is measured by five product-level signals: sales velocity, review moats, PPC bid density, listing quality, and brand dominance.
- Opportunity, not difficulty: Third-party tools approximate opportunity, not true difficulty, using varied formulas often based on search volume or review counts.
- Placement over scores: The TFSD framework offers a placement strategy for keywords (Title, Features, Search Terms, Description) over abstract difficulty scores.
- Decision matrix: A keyword pursuit decision matrix helps sellers strategically target keywords based on relevance and actual competition intensity.
- KPS measures impact: Keywords.am Priority Score (KPS) evaluates a keyword’s potential impact on a listing, aligning with Amazon’s product-centric ranking.
A third-party tool might show a “medium difficulty” for “garlic press,” suggesting a possible opening. A seller could then spend on a new product, optimize their listing, and launch a big PPC campaign. But months on, that product often sits on page three, despite high search volume. Listings with thousands of reviews and established sales histories outrank it. So, that “difficulty” score? It’s a ghost.
📑 Table of Contents
- Why doesn’t Amazon keyword difficulty work like Google’s?
- What are the 5 real signals of Amazon keyword competition?
- How do Amazon keyword tools calculate difficulty scores?
- How does the TFSD framework replace difficulty scores with placement strategy?
- The keyword pursuit decision matrix
- Frequently Asked Questions About Amazon Keyword Difficulty
- Conclusion
- References
Google’s keyword difficulty metric makes sense in Google’s world. More backlinks pointing at a page means it’s harder to outrank. Simple, measurable, consistent. Amazon’s A10 algorithm doesn’t work that way. There are no backlinks. There’s no domain authority. Yet sellers keep searching for “amazon keyword difficulty” and getting fed scores that pretend otherwise. Most of those top results aren’t even educational content; they’re tool landing pages, each hawking a proprietary number without explaining what competition on Amazon actually looks like.
This article argues amazon keyword difficulty, when viewed through a Google SEO lens, just isn’t a thing. Instead, competition depends on five product-level signals; abstract keyword-level scores don’t cut it. Upcoming sections will break down the core differences between Google and Amazon ranking. They’ll also introduce a concrete way to evaluate actual Amazon keyword competition and show how a product-centric approach to keyword evaluation fits Amazon’s reality better.
Why doesn’t Amazon keyword difficulty work like Google’s?
Amazon’s algorithm ranks products by sales velocity and conversion rates, not backlinks or domain authority, making Google’s keyword difficulty framework irrelevant.
Google assigns difficulty scores based on who’s linking to the ranking pages. Backlinks, domain authority, referring domains. Amazon’s algorithm couldn’t care less about any of that. Sales velocity, conversion rates, and listing quality run the show here.
Google’s keyword difficulty (KD) scores mostly come from the backlink profiles and domain authority of the top 10 pages ranking for a specific term. These things are measurable, pretty stable, and apply at the keyword level. Tools like Ahrefs and Moz have built whole methods around these signals, giving SEOs a consistent standard.
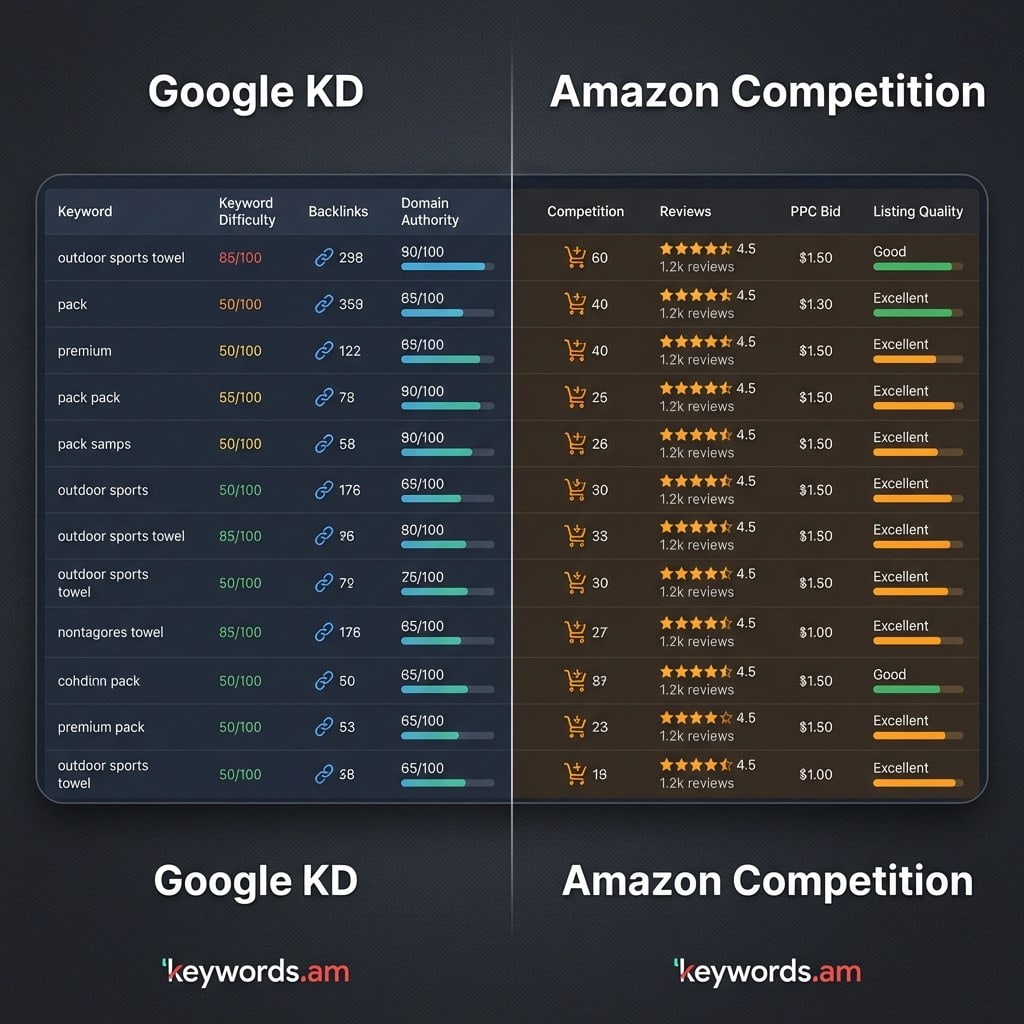
But Amazon operates differently. The Amazon A10 algorithm puts product-level performance first. It ranks products based on sales velocity, conversion rate, review moats (how many and how good the reviews are), smart PPC spend, and overall listing quality. These factors shift and are unique to each product. A keyword like “garlic press” might get a “medium difficulty” score in a third-party tool. But that difficulty rating means totally different things for a big brand with thousands of daily sales versus a brand-new seller on day one. For the established brand, it could be an easy win. For the new seller, it might be an impossible climb without spending a lot.
And here’s something worth sitting with: Ahrefs, a tool built entirely for Google SEO, consistently appears on page one when you search “amazon keyword difficulty.” That alone should tell sellers how tangled up these two ideas have gotten. If Google’s difficulty score doesn’t work here, then what signals truly show competition on Amazon?
What are the 5 real signals of Amazon keyword competition?
Amazon keyword competition is measured through five product-level signals: sales velocity, review moats, PPC bid density, listing quality gaps, and brand dominance.
So, instead of relying on some abstract amazon keyword difficulty score, sellers really should assess these concrete, product-level signals. It’s how you truly understand a keyword’s competitive landscape.
Signal 1: Sales velocity of page one products. This is the main entry barrier. What’s the Best Seller Rank (BSR) distribution look like for the top 10 results on a target keyword? Are those top products selling 500 units a month, or 50,000? A keyword where top listings consistently move tens of thousands of units monthly? That takes way more capital and a faster sales pace to break into than one where the average is under a thousand.
Signal 2: Review moats. Just look at the average review count for page one listings; that gives you a direct sense of the social proof barrier. A keyword where top products average 50 reviews is way more approachable for a new listing than one where the average is 5,000. And overcoming a huge review moat? That takes time, a really good product, and often, a big investment in those early sales.
Signal 3: PPC bid density. Suggested bid prices for a keyword directly show advertiser competition. Amazon’s PPC data? It’s probably the closest a seller gets to a real competition proxy. A keyword with an average suggested bid of $0.50 signals a different competitive vibe than one commanding a $5.00 bid. High bid density usually means lots of sellers are willing to pay big bucks to get seen for that term.
Signal 4: Listing quality gaps. You know, opportunity often shows up in competitors’ imperfections. Pull up the top 10 listings for a target keyword. Count how many have keyword-stuffed titles, three bullet points instead of five, or main images shot on a kitchen counter. Each gap is an opportunity. Doesn’t matter if that keyword gets 100,000 searches a month; sloppy competitors mean a polished listing can leapfrog them. Reverse ASIN lookup and competitor analysis tools make spotting these gaps systematic instead of accidental.
Signal 5: Brand dominance. Search “yoga mat” on Amazon and count how many page one results belong to Amazon Basics, Gaiam, or Manduka. If seven out of ten spots go to household names, that tells you something specific about the battle ahead. It doesn’t mean independent sellers can’t win those slots, though. The path just looks different: carve a niche (extra-thick travel mats, for instance) rather than competing head-on with identical products.
Signal |
What It Measures |
How to Evaluate |
Low Competition |
High Competition |
|---|---|---|---|---|
Sales Velocity |
Entry barrier |
Check BSR of top 10 |
Top 10 avg < 1,000/mo |
Top 10 avg > 10,000/mo |
Review Moats |
Social proof gap |
Count reviews on page 1 |
Avg < 100 reviews |
Avg > 2,000 reviews |
PPC Bid Density |
Advertiser demand |
Check suggested bid |
< $1.00 suggested bid |
> $3.00 suggested bid |
Listing Quality |
Optimization gaps |
Audit top 10 titles/images |
Poor titles, few images |
Fully optimized listings |
Brand Dominance |
Market concentration |
Count brand vs independent |
Mix of independent sellers |
7+ of top 10 are major brands |
How do Amazon keyword tools calculate difficulty scores?
Amazon keyword tools try to approximate difficulty using different formulas. Helium 10 uses search volume ratios. Jungle Scout weighs review counts and listing quality. And Keywords.am’s KPS measures listing impact potential, not some abstract difficulty.
Lots of third-party tools try to put a number on “difficulty” or “opportunity” for Amazon keywords. You’ve really got to understand the method behind these scores, though. They aren’t standardized and often measure different things entirely.
Helium 10 Cerebro IQ Score divides search volume by the number of competing products. Higher IQ equals fewer products per search. Sounds useful, and as a quick sorting tool, it can help separate high-volume terms from crowded ones. But that’s all it does. It won’t tell a seller with 12 reviews whether they can compete against a listing with 4,000 reviews on the same keyword. The score ignores sales history, conversion rate, and listing quality entirely.
Jungle Scout Opportunity Score factors in the average review count and listing quality of top results, plus search volume. This way, it gets closer to assessing actual competition than just raw search volume ratios. Why? Because it brings in two of those real signals mentioned earlier: review moats and listing quality. So, Jungle Scout definitely deserves credit for including more Amazon-specific metrics in its score.
Other tools, like SellerApp, Seodity, and KeySearch, also offer various keyword difficulty scores for Amazon. Many of them, originally built for Google SEO, just port over their methods with some tweaks for Amazon. They often focus on search volume versus competition ratios without really digging into Amazon-specific performance signals. That can lead to bad info when sellers assume the scores reflect the same dynamics as Google’s backlinks-driven difficulty.
Keywords.am KPS (Keywords.am Priority Score) flips the question entirely. Forget “how hard is this keyword?” KPS asks something sellers actually need answered: “if I add this keyword, how much does it move the needle for THIS listing?” KPS scores keywords 0-100 based on listing impact potential. A score of 85 for “organic dog treats” on one ASIN might drop to 30 on a different ASIN selling cat toys. That’s product-relative scoring, which mirrors how Amazon’s algorithm actually ranks products. And here’s what separates useful tools from noise: the data accuracy behind those scores. If the underlying data is shaky, no scoring formula can save it.
Bottom line: call these scores what they are. They aren’t difficulty metrics. They’re opportunity signals, each built on different assumptions and data inputs. The tools worth paying attention to? They measure how a keyword affects a specific listing. That’s a different animal from ranking keywords by abstract “difficulty.” Which raises the obvious next question: if scoring difficulty is the wrong frame, what should sellers be thinking about instead?
How does the TFSD framework replace difficulty scores with placement strategy?
The TFSD framework replaces abstract difficulty scores with a placement strategy: Title, Features, Search Terms, or Description based on coverage gaps.
It asks a practical question: does this keyword already appear in the listing, and if not, where should it go? Coverage gaps matter way more than competition scores.
Forget fixating on one difficulty number. A better approach? Think about keyword placement opportunity within a listing, using the TFSD framework: Title, Features, Search Terms, and Description. This framework helps you decide where each keyword should live to get the most impact. The title carries the most weight for ranking, then comes bullet points (features), then backend search terms, and finally the product description.
Coverage indicators show if a specific keyword is already in a listing. This metric often answers “should I add this keyword?” much more accurately than any general difficulty score. So, a keyword with zero coverage in a listing, even if a tool says it’s “high difficulty,” could be a big, easy-to-grab opportunity to boost visibility and relevance for that term.
Take a real scenario. Helium 10 flags “stainless steel water bottle” as “high difficulty,” and most sellers scroll right past it. But here’s the thing: if that phrase doesn’t appear anywhere in a listing (not the title, not the bullets, not even backend search terms), simply adding it to the backend field can create an immediate visibility boost. That one addition costs nothing and takes thirty seconds. The real question isn’t “can I rank for this?” It’s “where should this keyword sit in the listing, and did I already put it there?” The TFSD framework structures exactly this kind of decision. And sellers who want the full picture on keyword research methodology can layer competition signals on top.
Given these signals and this framework, how do sellers finally decide whether to go after a keyword?
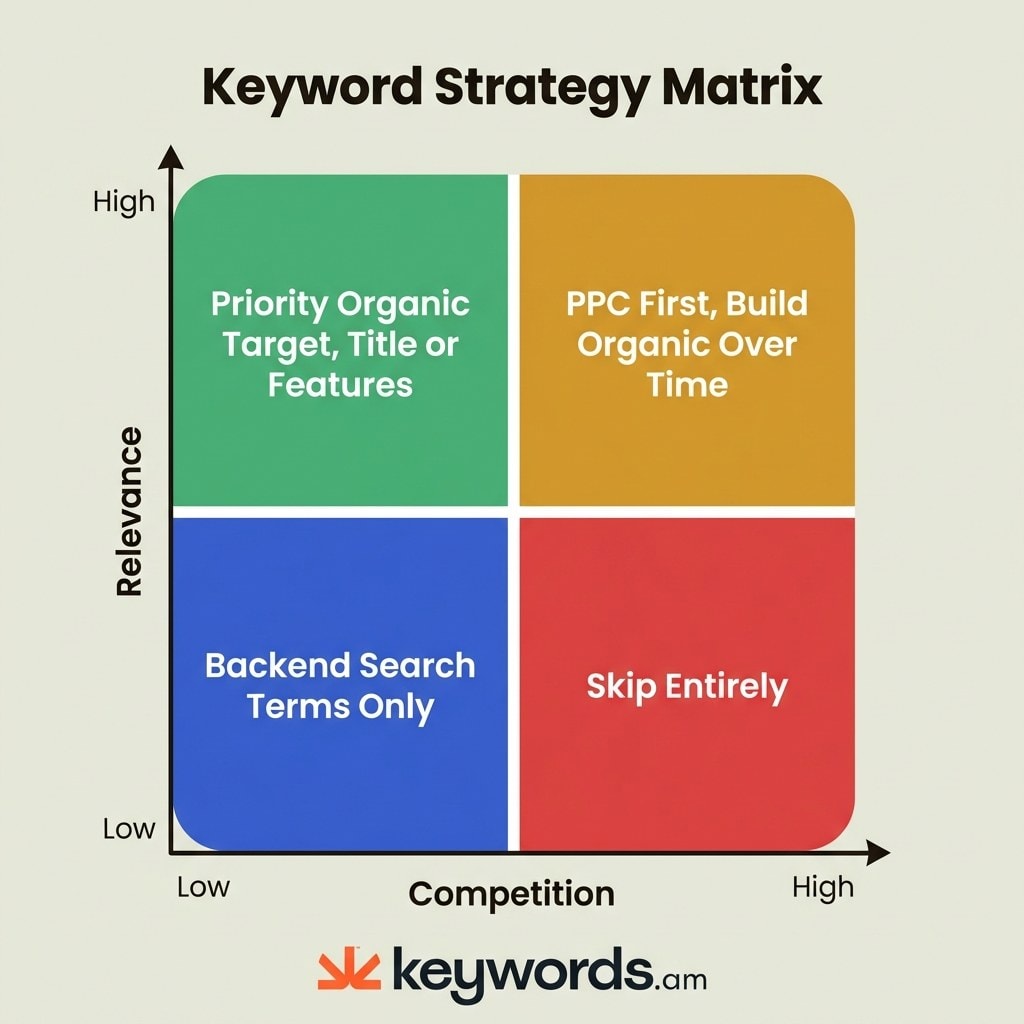
The keyword pursuit decision matrix
Plot keywords on two axes, competition intensity and product relevance, to determine whether to target organically, invest in PPC, or skip entirely.
The four quadrants tell you whether to prioritize organic placement, invest in PPC, use backend search terms, or just walk away from a keyword altogether.
Making smart keyword decisions really needs a strategic framework. One that moves past a single, often misleading, difficulty score. The keyword pursuit decision matrix gives you a practical 2×2 grid. It plots a keyword’s relevance to a product against its actual competition intensity (that’s derived from the five signals discussed earlier).
Quadrant 1: High relevance + Low competition. These are your priority organic targets. Keywords landing in this quadrant? They should go in the product’s Title or Features (bullet points). These are the “gold mine” opportunities; they can move a listing’s needle fastest with minimal ongoing investment. Many sellers miss these, though, fixing their gaze instead on high-volume, high-competition terms.
Quadrant 2: High relevance + High competition. These need a two-phase plan: PPC first, organic second. Bid on these terms to generate initial sales. Those PPC-driven sales create velocity. Velocity improves organic rank. Organic rank reduces PPC dependency. It’s a flywheel, not a money pit, as long as the keyword genuinely describes the product. The PPC keyword strategy guide breaks down the mechanics.
Quadrant 3: Low relevance + Low competition. These keywords are perfect for backend search terms only. They’ll snag long-tail or tangential traffic without cluttering up a visible listing with less relevant phrases. Amazon’s backend search terms field is specifically for these kinds of keywords. It gives you discoverability without messing with the front-end user experience. This also helps you avoid keyword cannibalization if a more relevant keyword exists for another product.
Quadrant 4: Low relevance + High competition. Walk away. A protein powder seller targeting “kitchen appliances” will burn budget and gain nothing. If a keyword doesn’t describe what the product actually does AND the competition is fierce, there’s zero reason to chase it. Spend that time on Q1 and Q2 keywords instead.
Low Competition |
High Competition |
|
|---|---|---|
High Relevance |
Priority organic: Title or Features placement |
PPC first, organic over time |
Low Relevance |
Backend search terms only |
Skip entirely |
Frequently Asked Questions About Amazon Keyword Difficulty
These are the most common questions sellers ask about keyword difficulty and competition on Amazon.
> Amazon doesn’t actually have a native keyword difficulty metric. So, third-party tools just approximate competition using proprietary formulas. These formulas usually rely on search volume ratios, review counts, and the listing quality of top results.
Unlike Google, where keyword difficulty measures backlink requirements, Amazon competition is really product-relative. The same keyword presents different challenges for different sellers; it all depends on their review count, sales history, and listing quality.
> Helium 10’s Cerebro IQ Score measures search volume against competing products. That approximates opportunity, but it doesn’t measure how hard it is to rank for a specific product or listing.
IQ Score is pretty useful as a quick filter for finding high-volume, lower-competition keywords. But it doesn’t consider a product’s unique competitive spot (its review count, BSR, or listing quality).
> You’ll want to check five signals: the sales velocity of page one results, the average review count, the PPC suggested bid, the listing quality of the top 10, and brand dominance. Lots of high signals mean strong competition.
No single metric tells the whole story. A keyword might have huge review moats, but if the top results have poor listing quality, it could still be an opening for a really well-optimized listing.
> New sellers should put high-relevance, low-competition keywords first for organic placement. And they should use PPC to slowly build visibility on competitive terms over time.
The keyword pursuit decision matrix helps with this: focus organic efforts on Quadrant 1 (high relevance + low competition) and use PPC for Quadrant 2 (high relevance + high competition). Just avoid Quadrant 4 entirely.
> Google keyword difficulty measures backlink strength and the domain authority of ranking pages. But Amazon keyword competition hinges on sales velocity, reviews, and listing quality. So, at their core, the concepts are just different.
Tools that try to port Google’s KD method to Amazon? They give misleading signals because Amazon’s ranking algorithm doesn’t use backlinks or domain authority.
> KPS (Keywords.am Priority Score) measures a listing’s impact potential on a 0-100 scale. It asks how much a keyword will improve a specific listing, not how hard it is to rank for in general.
This product-relative approach aligns with how Amazon’s algorithm works: relevance and conversion rate matter more than keyword-level competition metrics. You can see KPS scoring for all the details.
Conclusion
There is no universal keyword difficulty score on Amazon because the concept was borrowed from Google’s backlink-driven playbook and lost everything in translation.
Google ranks pages by backlink authority. Amazon ranks products by whether they sell. Those are different games with different scorecards. And the five signals covered in this article (sales velocity, review moats, PPC bids, listing quality, brand presence) tell the real story that no single score can capture.
Third-party tool scores are useful, sure. But you should really see them as opportunity indicators, not absolute difficulty metrics. Knowing the method behind those scores is key. The TFSD framework moves your focus from some abstract difficulty score to a practical placement strategy. Where does a keyword belong: Title, Features, Search Terms, or Description? Answer that, and the “difficulty” question answers itself. Pair it with the decision matrix (relevance vs. competition), and every keyword gets a concrete next step.
Go on, pick five keywords today. Run each one through those five competition signals (BSR, reviews, PPC bids, listing quality, brand presence). Bet you’ll find at least one keyword you’d written off as “too competitive” that’s actually wide open for a specific listing. Want to see the numbers? KPS scores keywords based on listing impact. Import an ASIN free at Keywords.am and swap guesswork for data.
References
- Amazon A10 Algorithm – Ranking factor details
- KPS Feature Page – KPS scoring methodology
- TFSD Framework – Title, Features, Search Terms, Description framework
- Coverage Indicators – Coverage gap analysis
- Amazon Seller Central – Keyword Research – Amazon’s native keyword research guidance
- Helium 10 – Cerebro IQ Score methodology