
📑 Table of Contents
- What should you check first when Amazon sales drop?
- Is it a traffic problem or a conversion problem?
- What causes Amazon traffic and visibility to decline?
- What causes Amazon conversion rates to drop?
- How do you diagnose keyword ranking loss on Amazon?
- How do you build a recovery plan after diagnosing the cause?
- Frequently Asked Questions About Amazon Sales Dropping
- Conclusion
⚡ TL;DR
- Pinpoint the date sales dropped before diagnosing the cause.
- Check sessions vs. conversion in Business Reports to split traffic problems from listing problems.
- Traffic diagnosis: check keyword rankings, indexing status, and SQP impression share.
- Conversion diagnosis: check Buy Box ownership, recent reviews, and competitor pricing.
- Keyword ranking decay is the most common and most underdiagnosed root cause.
- Map each root cause to a specific recovery path using the TFSD Framework.
Amazon sales dropping triggers a specific kind of panic. Sellers open twelve tabs, check every metric at once, and still can’t pinpoint what changed.
Most “why are my amazon sales down” guides dump 5-9 possible causes without a structured way to narrow the list. Sellers end up guessing, wasting days fixing things that aren’t broken while the real cause goes unaddressed.
This article introduces a 3-layer diagnostic framework: traffic, conversion, and market. Each layer maps to specific metrics in Seller Central Business Reports and Brand Analytics, with a clear fork that tells sellers where to go next.
What should you check first when Amazon sales drop?
The first step is identifying WHEN sales changed, not why. Correlate the drop date with listing edits, inventory events, algorithm shifts, and competitor moves to narrow the cause.
Random troubleshooting fails because it ignores the sequence of events. You’ve got to isolate the exact day the downward trend began before touching any listing variables. A clear timeline eliminates dozens of potential culprits in one step.
Compare the drop date against four event types:
- Listing changes — title updates, backend search term modifications, or main image swaps causing ranking fluctuations
- Inventory events — stockouts or FBA receiving delays that impact search visibility
- Algorithm updates — Amazon search changes or category policy shifts during that window
- Competitor moves — a rival launching a new variant, dropping price, or spiking ad spend
Navigate to Business Reports > Detail Page Sales and Traffic by Date in Seller Central. Look at a rolling 30- or 60-day window. A sudden cliff usually indicates a technical failure like suppression or Buy Box loss. A slow bleed suggests competitor pressure or keyword ranking decay.
Here’s a common trap: sellers check overall account sales and assume everything’s tanking. Usually, the drop is isolated to one or two ASINs carrying the bulk of revenue. Filter per-ASIN first. It saves hours of chasing ghosts across the entire product line.
Is it a traffic problem or a conversion problem?
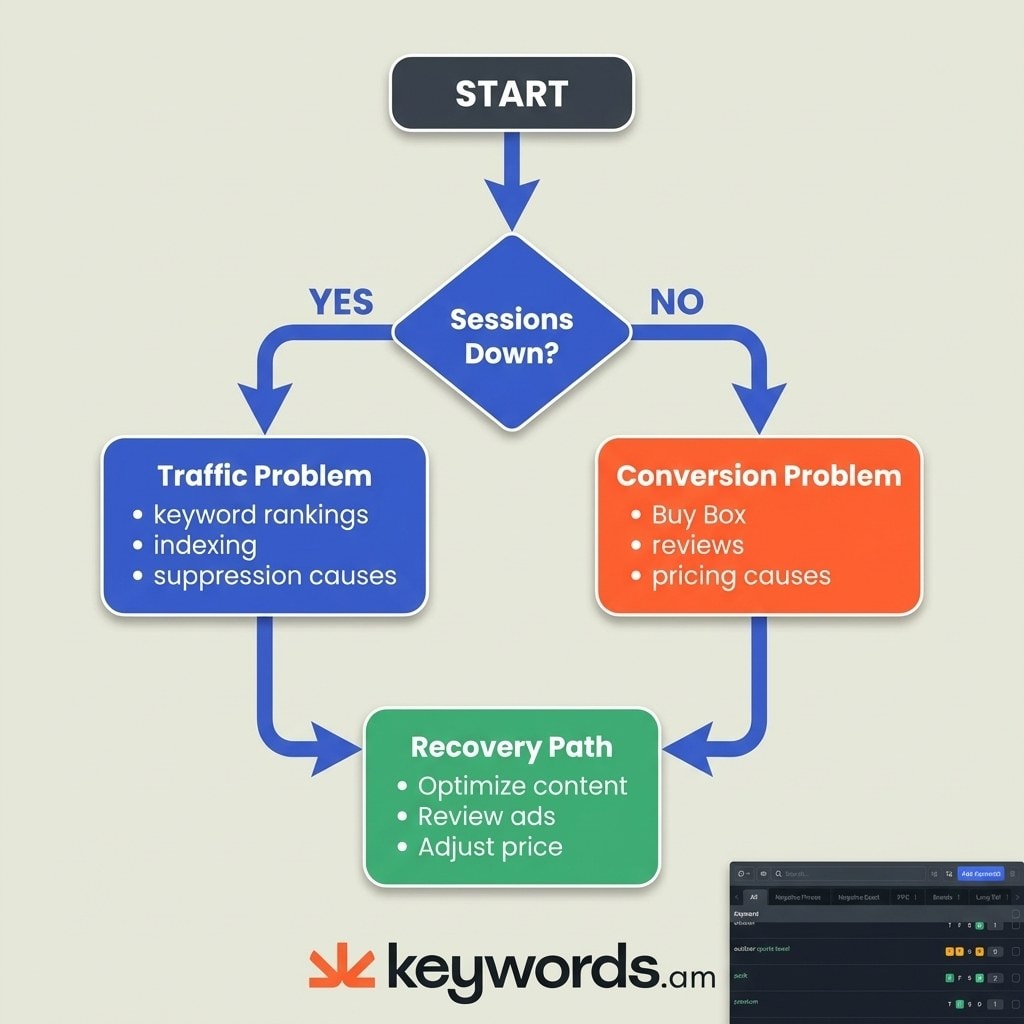
Check sessions and Unit Session Percentage in Business Reports. If sessions dropped, it’s a traffic problem. If sessions held but conversion fell, it’s a listing or offer problem.
This is the fundamental diagnostic fork. Every case of amazon sales dropping stems from either fewer people seeing the product or fewer people buying after they click. Separating these two stops sellers from optimizing a listing that needs more visibility, or doubling ad spend on a page that needs better content.
Traffic problem indicators: sessions trending down, page views dropping week over week, impressions declining in the Search Terms report. The algorithm isn’t displaying the offer to potential buyers.
Conversion problem indicators: sessions stable, but Unit Session Percentage (orders divided by sessions) declining. Shoppers find the product but choose a competitor instead.
Find both metrics under Business Reports > Detail Page Sales and Traffic by Child Item. Brand Registered sellers should cross-reference with the Search Query Performance dashboard in Brand Analytics.
Symptom |
Sessions |
Conversion (USP) |
Diagnosis |
Next Step |
|---|---|---|---|---|
Visibility loss |
↓ Down |
Stable or slight dip |
Traffic problem |
Check keyword rankings, indexing, ad impressions |
Listing/offer issue |
Stable |
↓ Down |
Conversion problem |
Check Buy Box, reviews, price, listing content |
Compound decline |
↓ Down |
↓ Down |
Start with traffic |
Fix visibility first, then reassess conversion |
What causes Amazon traffic and visibility to decline?
The six most common traffic killers are keyword ranking loss, keyword deindexation, listing suppression, Browse Node errors, reduced ad impressions, and declining SQP impression share.
Keyword ranking loss is the most frequent culprit — and the sneakiest. A gradual drop on core keywords where a product held page one won’t show up as an alert anywhere in Seller Central. There’s no “ranking dropped” notification. Sellers just see fewer sales and can’t figure out why. When a product slips from position 4 to position 14, traffic dries up fast.
Keyword deindexation is more severe — and more binary. Amazon simply stops indexing the listing for specific search terms, making it invisible even on page 10. Quick test: search the ASIN alongside the suspected keyword. If nothing appears, that term is deindexed. Fixing this requires understanding Amazon keyword indexing rules and refreshing backend search terms.
Listing suppression hides listings from search for policy violations. This can be full or partial (accessible via direct link but invisible in search). Common triggers: missing main images, restricted keywords in title, or pricing errors. Follow the Amazon listing suppression recovery protocol.
Browse Node miscategorization reduces relevance signals. Wrong category assignment means the algorithm assumes the product can’t satisfy search intent, dropping organic impressions.
Reduced ad impressions hurt sellers relying on PPC for traffic. Check Campaign Manager impression trends. High waste drains budgets before peak hours. Auditing Amazon negative keywords eliminates wasted spend.
Declining SQP impression share reveals competitive blind spots. Brand Analytics shows the exact share of impressions on specific queries. A downward trend means competitors are pushing the product lower. Amazon Brand Analytics SQP data is the most powerful diagnostic for Brand Registered sellers.
What causes Amazon conversion rates to drop?
Conversion drops typically stem from Buy Box loss, a negative review spike, price competitiveness erosion, listing content degradation, or competitor A+ Content improvements.
Buy Box loss is the single fastest way to kill conversion. If another seller wins the featured offer — or Amazon suppresses the Buy Box entirely because of off-platform pricing — conversion collapses overnight. Shoppers almost never click secondary links. Monitor Amazon Buy Box percentage in Business Reports. A win rate below 90% signals a problem requiring immediate pricing or inventory adjustments.
Negative review spike hits harder than most sellers expect. Even 2-3 new one-star reviews can tank conversion on a listing with fewer than 100 total reviews. If the star rating drops from 4.5 to 4.2 in 30 days? That’s a different product in the shopper’s mind.
Price competitiveness erosion happens silently. Competitors drop prices, or the listing loses Amazon’s “Was/Now” discount badge. A similar product in the “Related Items” carousel at a 20% discount pulls shoppers away. Evaluate Amazon keyword difficulty alongside pricing strategies.
Listing content degradation occurs when Amazon overwrites titles, merges duplicate listings, or suppresses images. Retail contributions sometimes override Brand Registry updates. Compare the live listing against the last known-good version. If content looks broken, apply an Amazon listing refresh strategy.
Competitor A+ Content improvements make existing listings look outdated by comparison. A rival upgrading brand story modules, comparison charts, and video content turns basic text into a liability. Routine Amazon competitor analysis prevents falling behind.
How do you diagnose keyword ranking loss on Amazon?
Run a reverse ASIN lookup on top competitors, compare their keyword rankings against yours, and track changes over time to identify which keywords are slipping.
When amazon sales dropping is the symptom, sales data alone never reveals which search terms a product abandoned on page one. Competitive intelligence fills that gap.
Step 1: Identify top revenue-driving keywords
Pull this list from the PPC Search Term Report or Brand Analytics Search Catalog Performance. Build a baseline of 10-15 core terms that historically generated the bulk of organic sales. Don’t guess. Let historical data dictate which keywords matter.
Step 2: Check current organic ranking
Are those core terms still on page one? Manual searching is unreliable due to Amazon’s personalization and location algorithms. Keyword tracking tools provide objective rank data.
Step 3: Run reverse ASIN on competitors
This is where the blind spots get exposed. A competitor launching a new variant, running aggressive exact-match PPC, or driving external traffic can quietly steal organic positions that took months to earn.
Step 4: Map ranking changes to the sales timeline
If keyword ranking drops started 7-14 days before sales fell off a cliff, that’s your answer. There’s always a lag between losing rank and losing revenue — the algorithm momentum runs out gradually, then sales follow.
Use SQP for share-of-voice analysis
Brand Analytics Search Query Performance shows impression share, click share, and purchase share. Declining purchase share on a stable-volume query means competitors are winning the same shoppers.
Tools like Keywords.am track daily ranking changes and flag drops automatically, helping sellers catch keyword decay before it becomes a revenue problem.
How do you build a recovery plan after diagnosing the cause?
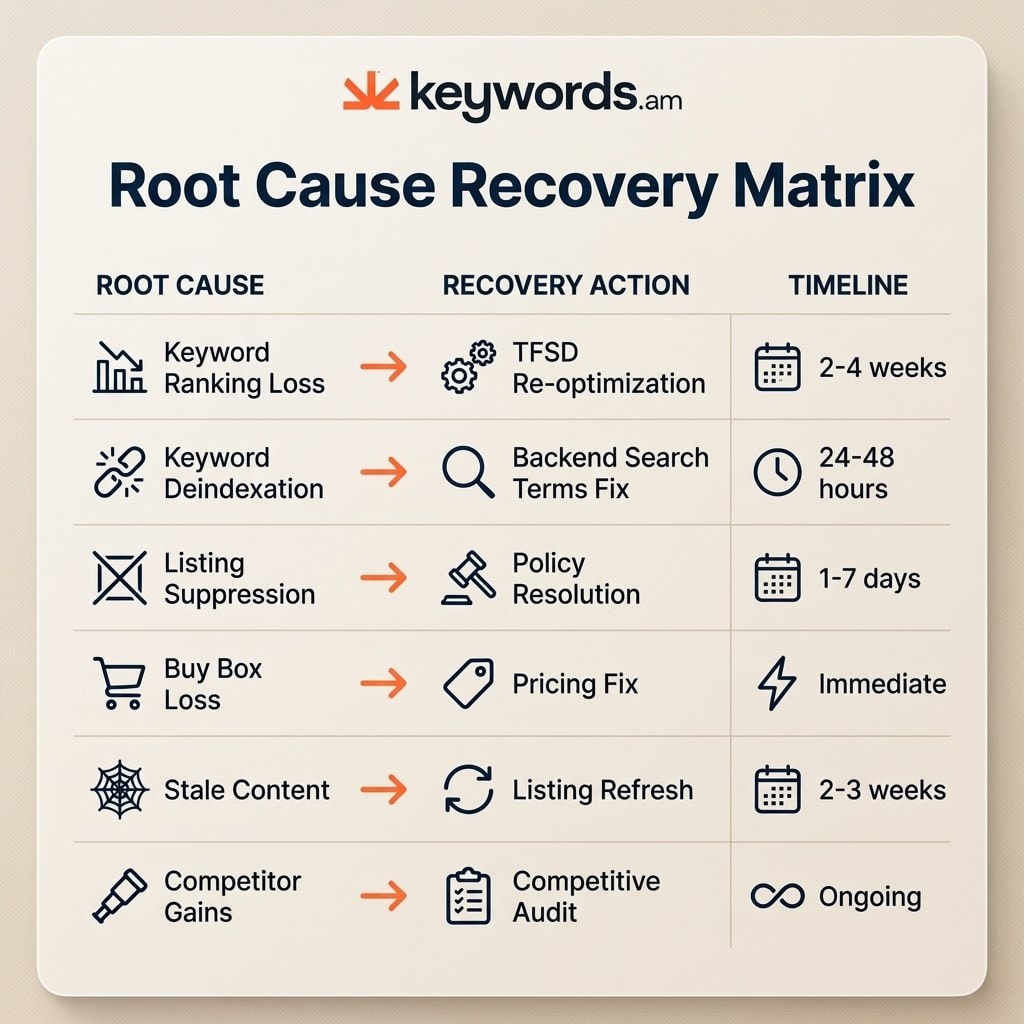
Match each root cause to its recovery path: the TFSD Framework for keyword issues, Buy Box fixes for offer problems, or strategy shifts for market changes.
Understanding why amazon sales dropping happened is only half the battle. Applying a conversion fix to a traffic problem wastes time. Changing the main image won’t fix a deindexed search term. Lowering price won’t restore a suspended listing. Every action must target the specific root cause.
Root Cause |
Recovery Action |
Deep Dive |
Timeline |
|---|---|---|---|
Keyword ranking loss |
Re-optimize Title, Features, Search Terms, Description |
2-4 weeks |
|
Keyword deindexation |
Verify indexation, refresh backend search terms |
24-48 hours |
|
Listing suppression |
Resolve policy violations, resubmit listing |
1-7 days |
|
Buy Box loss |
Fix pricing, FBA eligibility, seller metrics |
Immediate-2 weeks |
|
Stale listing content |
Refresh copy, images, A+ Content |
2-3 weeks |
|
Competitor gains |
Audit competitor keywords and listings |
Ongoing |
When the decline isn’t your fault
External factors disrupt sales across entire categories. Algorithm updates shuffle search results for weeks. Category-wide demand shifts happen during seasonal transitions or tariff changes. Check category Best Seller Rank trends. If all top competitors show similar declines simultaneously, the issue is market-wide, not listing-specific. Adjust inventory and ad budgets rather than over-optimizing a listing already performing at market capacity.
Frequently Asked Questions About Amazon Sales Dropping
These are the most common questions sellers ask when they first notice amazon sales are declining.
Conclusion
When amazon sales dropping becomes the daily reality, a structured 3-layer diagnostic stops the guessing and isolates the root cause with data.
Panicking leads to fixing things that aren’t broken. The 3-layer framework shifts the approach from reacting blindly to targeting the specific problem with evidence.
Start by separating traffic problems from conversion problems. That single check eliminates half the potential causes right away. Trace the timeline, analyze the specific layer, and apply the matching recovery path.
Take action now: open Business Reports and compare this week’s sessions against last week’s. That one data point determines whether this is a visibility problem or a detail page problem.
For a deeper diagnostic, run a free ASIN audit to check keyword indexation and ranking health across every search term on the listing.