Amazon Fundamentals
Amazon Brand Analytics Search Query Performance: The Ultimate Guide (5 Proven Workflows)
Master Amazon's Search Query Performance report with 5 proven Brand Analytics workflows to track SQP data, boost rankings, and win more search impressions.

Amazon Brand Analytics Search Query Performance gives brand-registered sellers the exact search queries shoppers type, how many times those queries show their listings, and how many of those impressions convert to clicks, cart adds, and purchases. It’s the most granular first-party keyword data available on any e-commerce platform. Yet most sellers who open the dashboard close it within a few minutes, overwhelmed by the volume of rows and the ambiguity of the column names.
The SQP dashboard isn’t intuitive. It shows thousands of queries with metrics that sound similar (Search Query Score vs. Search Query Volume), two different views (Brand View vs. ASIN View), and no built-in way to prioritize which keywords deserve attention first. Sellers often stare at a 1,000-row spreadsheet unsure whether to focus on the high-volume term with low conversion or the low-volume term with high conversion.
This guide explains every SQP metric in plain language, walks through the conversion funnel the data reveals, and gives you five workflows you can run today to turn raw SQP data into listing and PPC improvements.
What is Amazon Brand Analytics and who gets access?
Amazon Brand Analytics is a free reporting suite inside Seller Central available to brand-registered sellers. It provides first-party data on search behavior, demographics, and market basket analysis.
Brand Analytics costs nothing beyond Brand Registry enrollment. Sellers often assume this level of data requires a paid tier, but it’s bundled with brand protection by default.
Eligibility requires active enrollment in Amazon Brand Registry with a registered or pending trademark. Once enrolled, the brand owner account gains access to the reports.
To find the report, go to Seller Central, then Brands, then Brand Analytics, then Search Query Performance. Brand Analytics includes other reports like Market Basket Analysis and Demographics, but Search Query Performance (SQP) is the deepest keyword-level funnel data, which makes it the main tool for search optimization.
Knowing where to find the report is step one. The real challenge is understanding what each column actually means.
What does the Search Query Performance dashboard show?
The SQP dashboard offers two views (Brand View for all brand queries and ASIN View for a single product) with weekly, monthly, or quarterly reporting periods.
Brand View aggregates all search queries across your catalog, while ASIN View isolates queries for a single product. Use Brand View for portfolio-level strategy and ASIN View for individual listing work. A kitchenware brand might see 847 queries in Brand View, then filter to 23 queries driving traffic to a single silicone spatula in ASIN View.
Reporting periods are weekly, monthly, and quarterly. Weekly data is best for live optimization, quarterly smooths seasonality, and monthly tends to be the right balance for most sellers.
The report caps at the top 1,000 search queries by relevance. This covers most traffic for most brands, though niche long-tail queries may fall outside the cap.
SQP dashboard columns reference
| Metric | What it measures | Why it matters |
|---|---|---|
| Search Query Score | Relative importance ranking (not volume) | Shows which queries matter most for your brand |
| Search Query Volume | Approximate search count in the period | Raw demand indicator |
| Impressions (Total) | Times any product appeared for this query | Market size indicator |
| Impressions (Brand Share %) | Your brand’s share of total impressions | Your visibility on this query |
| Clicks (Total) | Total clicks from this query | Engagement indicator |
| Clicks (Brand Share %) | Your share of total clicks | Click-through competitiveness |
| Cart Adds (Brand Share %) | Your share of cart additions | Mid-funnel conversion signal |
| Purchases (Brand Share %) | Your share of purchases | Bottom-funnel conversion signal |
The column names make sense on paper. The real insight lives in the relationships between them.
What do the 5 key SQP metrics actually mean?
The five core metrics (Search Query Score, Search Volume, Impressions, Clicks, and Purchases) form a conversion funnel from discovery to transaction that reveals exactly where shoppers engage or drop off.
Search Query Score isn’t a volume number. It ranks how important a query is to your brand relative to the overall marketplace. A score of 1 means it’s the top query for the brand. Tracking score over time flags trending terms that are becoming more critical to the business.
Search Query Volume is the approximate number of times shoppers typed this exact query. Use it with caution. Amazon rounds the figure and it swings with seasonality. Volume alone is often a vanity metric; a high-volume keyword that drives no sales is less valuable than a smaller keyword that converts.
Impressions plus Brand Share measures how many times products appeared for a query and your percentage of those appearances. Low brand share on a high-volume query signals growth headroom. High brand share with low clicks points to a title or main image problem.
Clicks plus Brand Share tracks how many shoppers click through to the detail page. The gap between impression share and click share reveals listing attractiveness. If impression share is 15% but click share is 5%, the main image, title, price, or review count isn’t winning the click.
Cart Adds and Purchases plus Brand Share sit at the bottom of the funnel. High clicks but low cart adds suggests problems with price, bullet points, or A+ content. High cart adds but low purchases usually points to competitor comparison or availability. See our guide to Amazon conversion rate for the fixes that move each of these numbers.
Understanding individual metrics is useful. The real power comes from reading the gaps between them.
How do you read the SQP funnel from impressions to purchases?
Read the SQP funnel by comparing brand share at each stage (impressions, clicks, cart adds, purchases) to identify where shoppers engage with or abandon the listing.
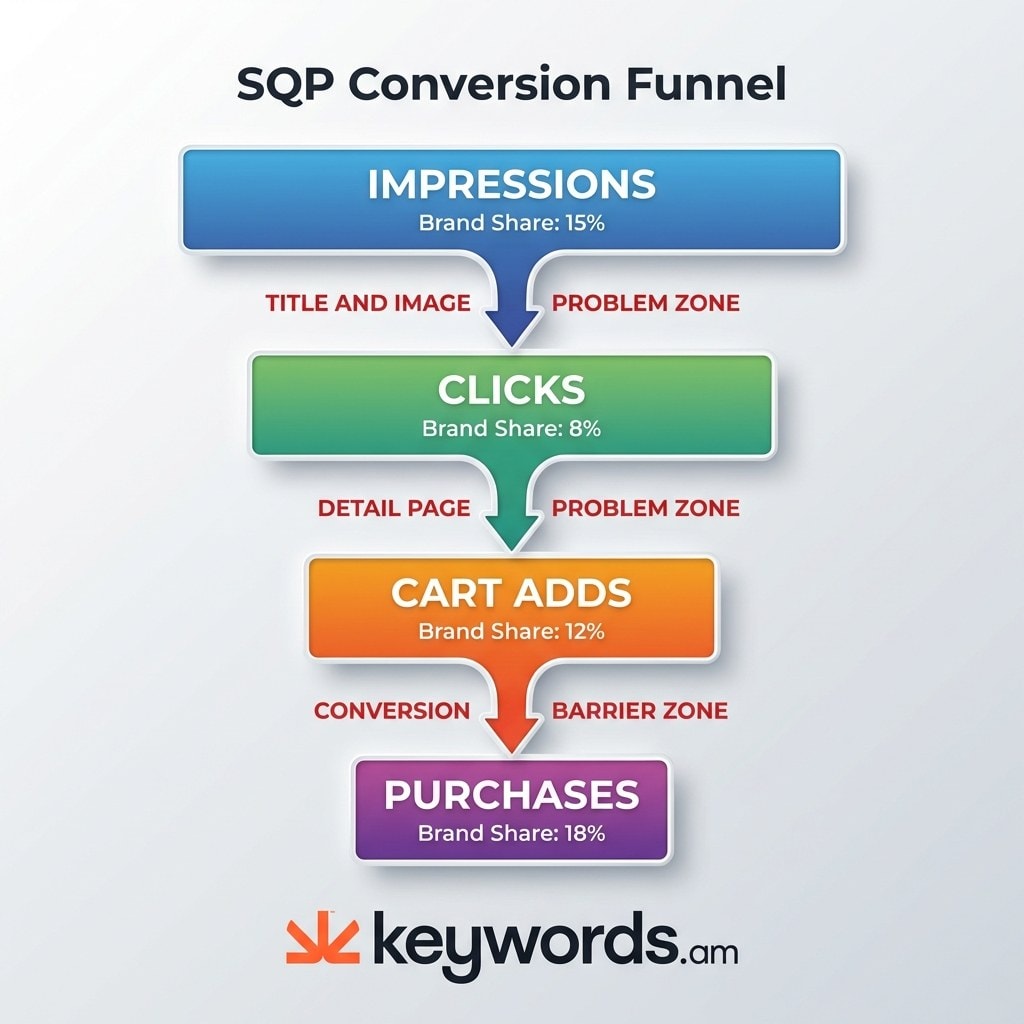
Healthy listings maintain or grow their share at each stage. Problematic listings show sharp drops. Follow this three-step diagnostic:
- Compare impression share to click share. A 20% impression share with a 5% click share points to a title or main image problem. Amazon is showing the listing, but shoppers aren’t biting. Revisit title optimization, main image contrast, and price visibility on the search results page.
- Compare click share to cart add share. 10% click share with 2% cart add share points to a detail page problem. Audit your bullet points, A+ content, reviews, and price.
- Compare cart add share to purchase share. 10% cart adds falling to 3% purchases points to a conversion barrier at checkout, often delivery speed, competitor price matching, or stock availability.
Knowing how to read the funnel is the foundation. Now let’s turn that knowledge into specific workflows.
What are 5 actionable workflows using SQP data?
Five practical workflows cover discovering untargeted traffic keywords, fixing high-impression low-click terms, prioritizing PPC keywords by purchase share, spotting competitor queries, and benchmarking brand versus category performance.
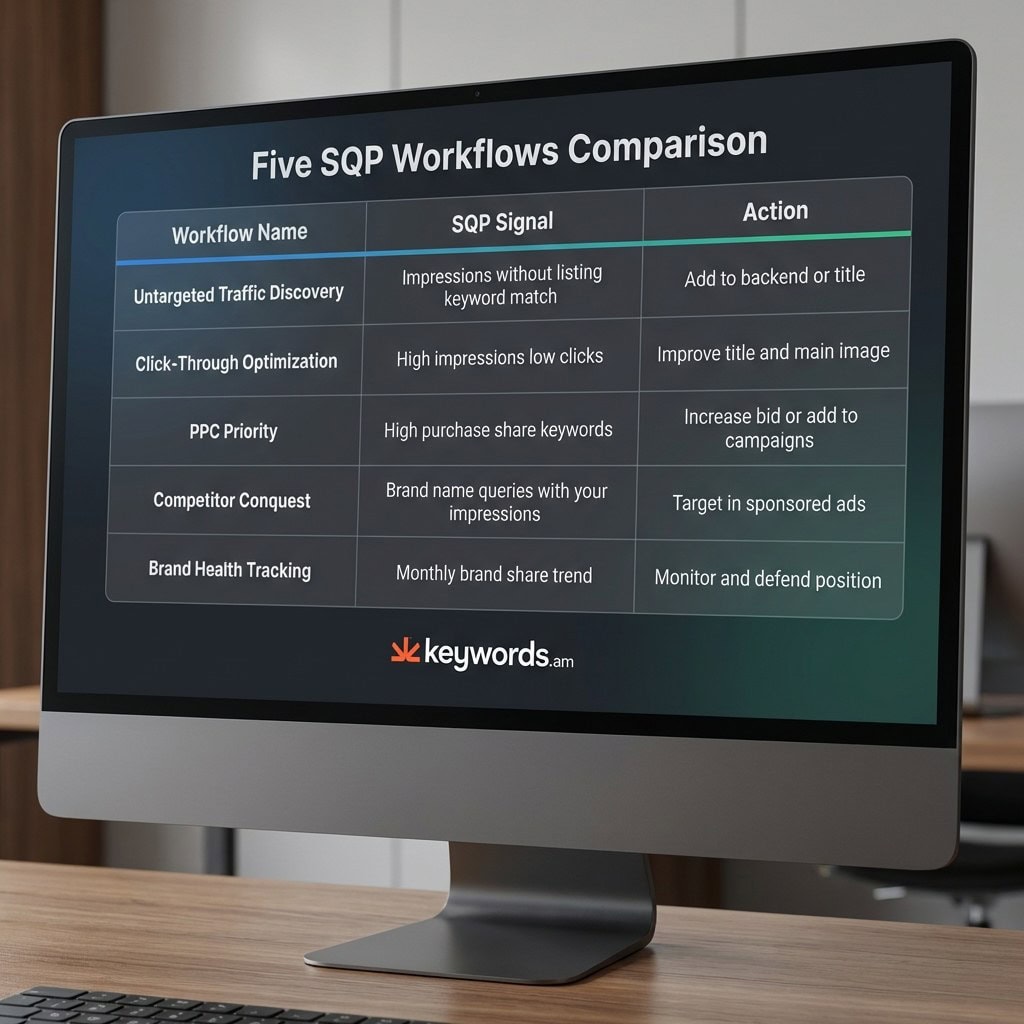
Workflow 1: Find keywords bringing traffic you don’t explicitly target. Filter ASIN View for queries with impressions where the keyword isn’t in the title, bullets, or backend keywords. These are organic ranking opportunities. If a product ranks for a term without direct optimization, adding that term to backend search terms helps lock the rank in.
Workflow 2: Identify high-impression, low-click keywords for title optimization. Sort by impression share descending, then flag queries where click share drops sharply. These listings appear in search but fail to earn the click. See Amazon listing optimization for the fixes that typically move click share.
Workflow 3: Prioritize PPC keywords by purchase share. Sort by purchase share to find queries that already convert organically. These are the safest bets for Sponsored Products because they have proven purchase intent. Instead of guessing with high-volume keywords, double down where the product already wins. More context in our Amazon PPC optimization guide.
Workflow 4: Spot competitor queries where your brand appears. Look for queries containing competitor brand names where your ASIN has impression or click share. Shoppers are comparison shopping, which creates a conquest opportunity. Pair this with competitor analysis and a reverse ASIN lookup on their listings.
Workflow 5: Compare brand vs. category performance over time. Track brand share percentages monthly. Rising brand share on steady-volume queries signals organic growth. Falling brand share signals competitive pressure. This fits inside a broader Amazon keyword research methodology focused on long-term market position.
These workflows are powerful, but they all share the same bottleneck: manual execution across thousands of rows.
Why is raw SQP data hard to use on its own?
Raw SQP data lacks built-in prioritization, forcing sellers to manually sort thousands of keyword rows without knowing which deserve immediate action.
Most brands see 500 to 1,000 queries in the SQP report. Analyzing each one across the full funnel takes real time. At two minutes per query, a 500-query report is 16 hours of manual work. Few sellers run that cadence consistently.
Amazon shows the data but doesn’t rank keywords by potential impact. A query with 10,000 impressions and 2% brand share may matter less than one with 500 impressions and 40% brand share, but the report doesn’t surface that distinction. The absence of a clear starting signal leads to analysis paralysis.
A scoring layer solves this by weighing demand, relevance, opportunity, and data trustworthiness to rank every SQP keyword on a 0-100 scale. High-scoring keywords demand immediate focus, letting sellers skip the sorting and go straight to optimization.
Pattern tags translate funnel gaps into actions automatically. Labels like “Underexposed” flag demand without visibility. “Shown but skipped” highlights impression-to-click gaps. “Clicks but confusion” surfaces cart abandonment. With or without a tool, certain mistakes with Brand Analytics data are almost universal.
What are the most common mistakes sellers make with Brand Analytics?
The three most common mistakes are chasing high-volume keywords without checking purchase share, ignoring low-volume terms that drive actual sales, and failing to cross-reference SQP data with listing content.
Mistake 1: Over-indexing on search volume. Sellers sort by volume and optimize for the biggest numbers. A 50,000-volume keyword with 0.1% purchase share matters far less than a 2,000-volume keyword with 15% purchase share. Volume is noise without conversion context. See Amazon search volume for how to interpret these numbers.
Mistake 2: Ignoring purchase-driving long-tail queries. Low-volume, high-purchase-share queries represent shoppers with high intent who already buy from the brand. A query like “silicone spatula heat resistant 600 degrees” moves fewer impressions than “spatula” but typically carries a far higher purchase share. Protecting these keywords is critical for margin.
Mistake 3: Not cross-referencing SQP with listing content. SQP tells you which keywords drive traffic; it doesn’t tell you if the listing is optimized for them. If high-performing keywords aren’t in the title, bullets, or backend search terms, indexing is left to chance. A monthly cross-reference keeps the listing aligned with how shoppers actually search.
Frequently Asked Questions About Amazon Brand Analytics Search Query Performance
Is Amazon Brand Analytics free to use?
Yes, Brand Analytics is free for sellers enrolled in Amazon Brand Registry with an active registered or pending trademark. There’s no additional subscription or monthly fee. As long as Brand Registry enrollment stays active, every report inside Brand Analytics (including Search Query Performance) is available at no extra cost.
How often does Search Query Performance data update?
SQP data is available in weekly, monthly, and quarterly reporting periods, with weekly data usually appearing within about a week of the period ending. Monthly data provides the best balance of recency and statistical stability. Weekly data can be noisy for lower-volume products but useful for tracking PPC campaign impact.
Can I export Search Query Performance data?
Yes, the SQP report supports CSV export from the dashboard, which lets sellers analyze the data in spreadsheets or feed it into third-party tools. The export includes all visible columns across your selected view and period. Many analytics platforms also pull SQP data directly through the Brand Analytics API, which removes the manual export step.
What is the difference between Search Query Score and Search Query Volume?
Search Query Score ranks a query’s importance to your brand relative to the market, while Search Query Volume measures the approximate number of times shoppers typed that query. A query can carry a high score but moderate volume if it’s highly relevant to your brand. Score reflects brand-specific importance; volume reflects total market demand.
Does SQP data include sponsored (PPC) results or only organic?
As of early 2026, SQP combines both organic and sponsored impressions, clicks, cart adds, and purchases into single totals per query. It doesn’t split the two, which means a high impression share can be partly driven by ad spend. To isolate organic performance, compare SQP data with your Sponsored Products search term reports.
Conclusion
- The SQP report reveals the full search funnel from query to purchase for a brand’s keywords, exposing where shoppers drop off.
- Reading brand share across stages tells you whether a listing has a title problem, a detail page problem, or a conversion barrier.
- Purchase share beats volume as the starting signal for both organic and PPC prioritization.
- Monthly cross-referencing keeps your title, bullets, and backend aligned with how shoppers actually search.
- A 10-minute weekly audit on your top ASIN usually surfaces the lowest-hanging fruit on the listing.
Open Seller Central, go to Brand Analytics, then Search Query Performance. Pull the last 30 days in ASIN View for your top product, sort by impressions, and compare click share to impression share on the top three queries. For sellers who’d rather skip the spreadsheet and let a scoring system handle prioritization, start a Keywords.am account and let the system surface what matters first.