Keyword Research
The best Amazon search volume guide (what the numbers actually mean)
Amazon search volume data is estimated, not exact. Learn category benchmarks, marketplace differences, and a trust framework to make better keyword decisions.
A seller sees a keyword showing 2,400 monthly searches and stares at the screen. No context, no history, no indication of whether the term is worth an advertising budget.
Every tool displays Amazon search volume. Almost none explain what those numbers represent. A raw search count labeled “high” in the industrial fastener category is a rounding error in the phone case market. Sellers spend hours chasing numbers without understanding the context behind them.
This guide provides the missing interpretation layer: category benchmarks, marketplace scaling factors, seasonal pattern identification, and an honest framework for judging data accuracy. Context transforms raw amazon search volume data into a reliable keyword research methodology.
How Are Amazon Search Volume Estimates Generated?
Amazon shut down its search volume API in December 2018. Every third-party search volume number is now an estimate derived from PPC impressions, clickstream panels, or Brand Analytics correlation.
The platform officially disabled direct search API access on December 13, 2018. Any data claiming to be exact after that date relies on third-party estimation algorithms. Sellers evaluating amazon data accuracy must understand the three primary methodologies replacing direct API access.
The most common approach is PPC impression extrapolation. Tools run sponsored campaigns across millions of keywords with bids high enough to guarantee placement. Amazon reports how many impressions each keyword receives, and algorithms convert those impressions into an estimated monthly search count. If a keyword pulls ten thousand impressions, it’s clearly popular. But the conversion from impressions to “searches” involves assumptions that vary by tool.
Another method is clickstream data. Providers track the browsing behavior of millions of users through browser extensions, then extrapolate from that panel to estimate total Amazon traffic. It captures real behavior, but the panel is still a fraction of Amazon’s full user base, so low-volume keywords end up with unreliable estimates.
The third method maps PPC-derived volume points to specific Search Frequency Rank positions in Brand Analytics, then draws a curve through those anchor points. Every keyword gets an estimated volume based on where it sits on that curve. Here’s the catch: different tools blend these three methods differently, with different sample sizes and normalization logic. There’s no single “correct” number.
Understanding these origins explains why tools disagree. But a deeper structural difference causes even more confusion among sellers.
What Is the Difference Between Absolute and Relative Search Volume?
Search Frequency Rank from Brand Analytics is a relative position. Third-party estimated monthly searches are absolute numbers. They measure different things and should not be compared directly.
Amazon does provide its own popularity metric through Brand Analytics. Search Frequency Rank (SFR) ranks every search term by popularity against all others. SFR #1 is the most popular search on the platform. SFR #5,000 is still very popular. SFR #500,000? That’s deep niche territory. The key detail: SFR is relative, not absolute. A keyword can jump from SFR 12,000 to SFR 8,000 without its actual search count changing - it just moved up because other terms declined. Sellers mapping amazon brand analytics search query performance track these positional shifts closely.
Third-party tools try to convert that relative rank (or impression data) into an absolute number: “2,400 searches per month.” That’s an estimate of total volume, not a ranking. It’s a fundamentally different measurement.
And here’s where things get confusing. Some tools count normalized searches (unique shoppers). If someone searches “garlic press” three times in one week, that’s one search. Other tools count denormalized searches (total search events). Same shopper, three searches, three counts.
Brand Analytics leans toward denormalized. Helium 10 uses normalized counts. Jungle Scout tracks denormalized events. Both can be accurate within their own definitions. They’re just measuring different things.
Once sellers understand what the numbers represent, the next question is what counts as “good.” And that answer changes depending on the product category.
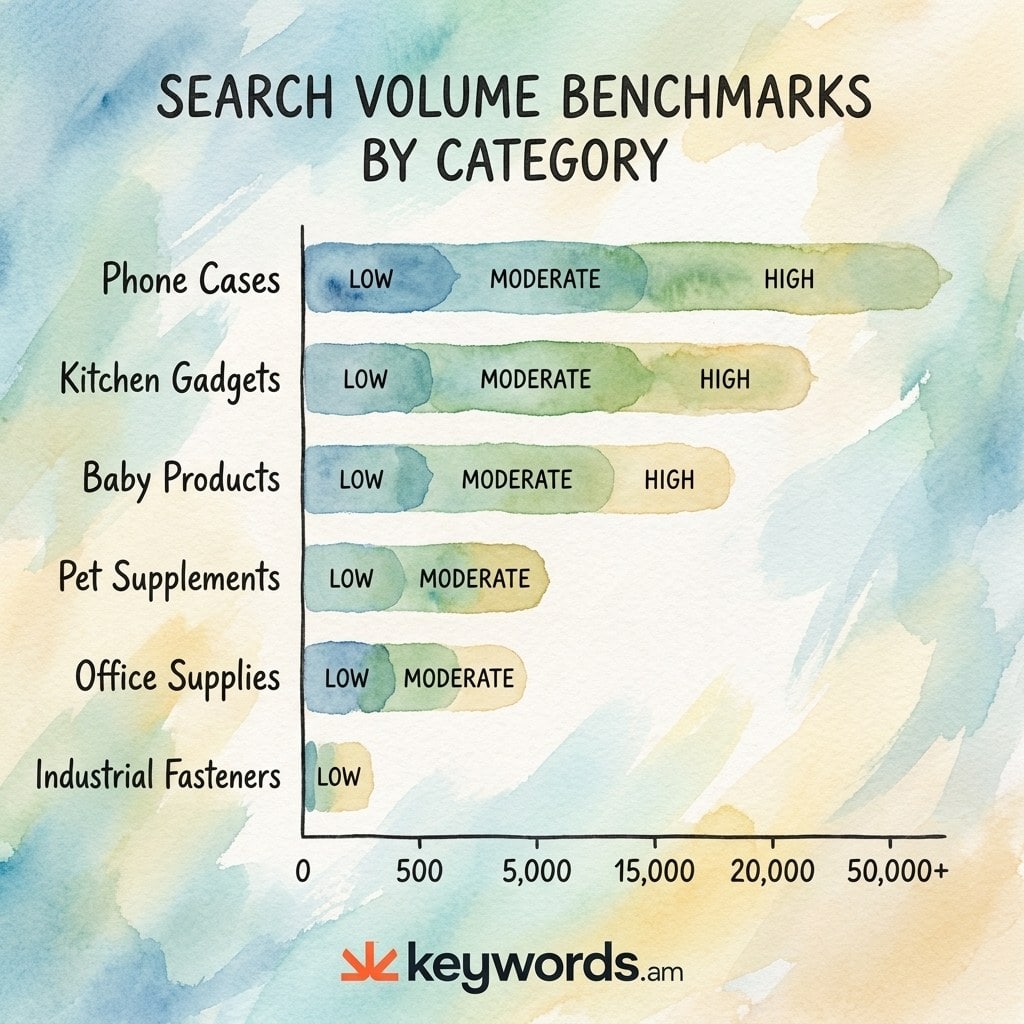
What Does ‘Good’ Amazon Search Volume Look Like by Category?
A good search volume depends entirely on the product category. 500 monthly searches in industrial fasteners represents a high-demand keyword. In phone cases, that same number is invisible.
Category context defines keyword viability. A brand that’s been selling kitchen gadgets will experience real culture shock moving into pet supplements - volume expectations don’t transfer across markets. Sellers mapping amazon keyword clustering must recalibrate their baseline for every new product launch.
| Product Category | Low Volume | Moderate Volume | High Volume | Example Keyword |
|---|---|---|---|---|
| Phone Cases & Accessories | <5,000 | 5,000-50,000 | 50,000+ | “iphone 16 case” |
| Pet Supplements | <500 | 500-5,000 | 5,000+ | “dog joint supplement” |
| Industrial Fasteners | <100 | 100-500 | 500+ | “m8 stainless steel bolt” |
| Kitchen Gadgets | <2,000 | 2,000-20,000 | 20,000+ | “garlic press” |
| Baby Products | <1,000 | 1,000-15,000 | 15,000+ | “baby monitor” |
| Office Supplies | <500 | 500-5,000 | 5,000+ | “label maker” |
| Outdoor/Camping | <1,000 | 1,000-10,000 | 10,000+ | “portable water filter” |
| Specialty Health | <200 | 200-2,000 | 2,000+ | “magnesium glycinate” |
These figures represent approximate ranges based on aggregate keyword data. The 100x difference between high-traffic categories and technical niches is the point. A seller in the industrial fastener space targeting keywords with 300 searches per month is capturing prime traffic. A phone case seller targeting 300 searches per month won’t see a single sale. Universal labels fail constantly.
Instead of applying generic thresholds, build a category-relative baseline in three steps:
- Pull the top twenty keywords for the highest-ranking competitor in the niche.
- Average the search volume of the top five terms - that’s the high-volume ceiling.
- Average positions fifteen through twenty - that’s the moderate baseline.
This process highlights the actual value of amazon long tail keywords within a specific space. Category benchmarks stabilize expectations within a single country. But international expansion shatters those baselines entirely.
How Does Amazon Search Volume Differ Across Marketplaces?
Amazon US typically has five to fifteen times more search volume than European marketplaces. A keyword with 10,000 US searches might have only 800 in Germany.
The US marketplace dwarfs every other Amazon site in search activity. Sellers routinely make the mistake of projecting US volume expectations onto smaller countries - but a keyword that fails a US threshold test might be a top performer in a European market. Adjusting expectations requires studying amazon international keyword research fundamentals.
| Marketplace | Relative Scale (vs US) | Approx. Factor | Notes |
|---|---|---|---|
| US (.com) | Baseline | 1x | Largest marketplace by search volume |
| UK (.co.uk) | Moderate | 0.15-0.25x | Second-largest English-language market |
| DE (.de) | Moderate | 0.10-0.20x | Largest EU marketplace |
| JP (.co.jp) | Significant | 0.15-0.30x | High volume in electronics/beauty |
| CA (.ca) | Small | 0.08-0.15x | Often mirrors US trends |
| IN (.in) | Growing | 0.05-0.15x | Rapid growth, lower absolute volume |
These are approximate ranges, but they illustrate the point. A seller who won’t target anything under 3,000 monthly searches in the US would eliminate profitable products in Canada by applying the same rule.
Sellers expanding internationally need to recalibrate volume thresholds by marketplace. A keyword with 1,500 searches in the UK represents serious buying intent. Data platforms covering global markets allow brands to filter and verify these regional thresholds. Keywords.am supports twenty-one marketplaces to provide exact regional visibility.
Geography dictates one major shift in volume data. Time dictates another.
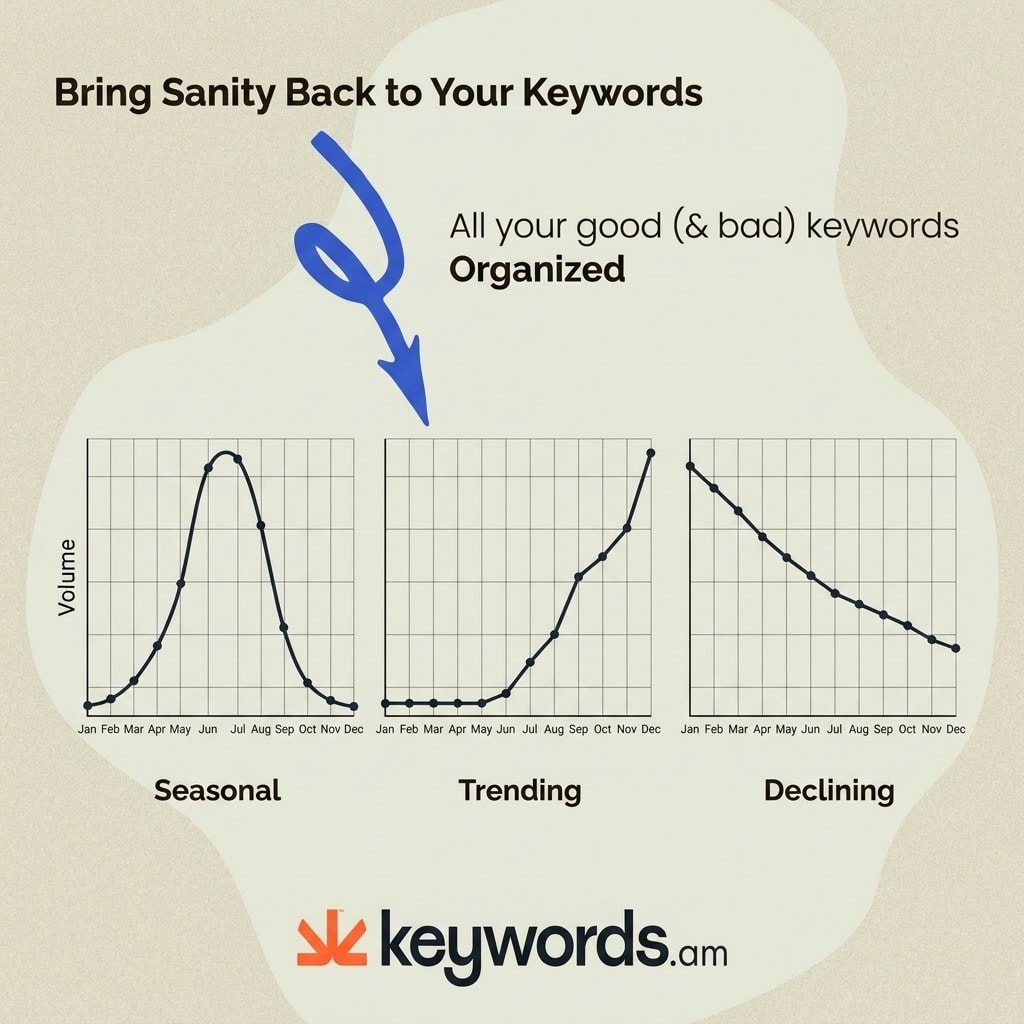
How Do You Identify Seasonal, Trending, and Declining Keywords?
Seasonal keywords spike predictably each year. Trending keywords show sustained growth over months. Declining keywords show falling volume with no recovery. Historical data separates the three distinct patterns.
A snapshot of current volume provides no strategic value. A keyword showing 15,000 monthly searches today might vanish next month. Analyzing amazon seasonal keyword strategy requires historical context stretching back twelve to twenty-four months.
Consider the seasonal pattern of “pool chlorine tablets”. Volume stays flat from September through February. Demand spikes starting in March, peaks in June, and collapses by August. This exact bell curve repeats annually. A seller observing 15,000 searches in June cannot build a December revenue forecast on that number.
Trending keywords follow a different lifecycle arc. The phrase “iphone 16 case” demonstrates typical product launch behavior. Volume rises sharply in September. It stays elevated for six to eight months. Demand eventually plateaus and slowly declines as the next hardware model approaches. The trend line points up and stabilizes.
Declining keywords act as hidden traps for sellers who skip the historical check. Take “fidget spinner” - the term peaked in 2017, and search volume dropped by over ninety percent. It shows no seasonal recovery. Current volume remains a fraction of historical highs. A keyword displaying 2,000 searches per month today looks acceptable. But if that same keyword had 50,000 searches two years ago, the market is actively dying.
Building a baseline is straightforward. Run three checks on any keyword:
- Look at 12+ months of data. Repeating peaks and valleys? Seasonal.
- Trend line going up? That’s a trending keyword with growing demand.
- Steady decline with no recovery? Walk away. The market is shrinking.
These patterns dictate inventory timing, ad spend, and whether a keyword is worth optimizing for. But sellers still face the core dilemma: how accurate is this data in the first place?
When Should You Trust Amazon Search Volume Data?
No third-party keyword volume tool is perfectly accurate. The useful question is not whether the number is exact. Sellers must ask if the number is directionally reliable.
The industry argues over metric accuracy. Helium 10 published a study claiming their tool hit 93.5 percent accuracy against actual Amazon data. They claimed Jungle Scout managed only 41.9 percent. An independent test by eComCrew painted a different picture - both tools missed the actual Amazon mark by 84 to 87 percent on average.
The winner changed depending on the keyword. This discrepancy ties back to the normalization issue covered earlier. A keyword showing 5,000 unique searches in one tool and 12,000 total search events in another can both be factually correct. They measure different user behaviors. Evaluating amazon data accuracy requires accepting this fundamental variation. Sellers must also weigh amazon keyword difficulty alongside volume to gauge true opportunity.
Relying on search volume requires a practical, structured trust framework:
- Use volume strictly for relative comparison between keyword options, never for absolute revenue forecasting.
- Cross-reference third-party estimates with Brand Analytics Search Frequency Rank when available.
- Validate third-party estimates with actual PPC impression data generated by active campaigns.
- Trust historical trend lines and seasonal patterns far more than a single absolute number.
- Treat competing tools as roughly equivalent when they disagree by less than a factor of two.
From Amazon Search Volume to Business Decisions
Here’s a practical formula to bridge volume data and actual revenue potential:
Worked example: A product sells for $25, costs $10 (including FBA fees), leaving $15 margin. The listing converts at 10%. The seller wants at least $150/month from a keyword.
- $150 ÷ $15 margin = 10 sales needed
- 10 sales ÷ 10% conversion = 100 clicks needed
- 100 clicks ÷ 30% CTR (from a top organic spot) = ~333 searches/month minimum
Below 333 monthly searches, that keyword can’t generate $150 in profit - even at the #1 ranking. Swap in your own margins and conversion rates, and you’ve got a personalized minimum volume threshold for every keyword on the list.
Frequently Asked Questions About Amazon Search Volume
These are the most common questions sellers ask about amazon search volume data and how to interpret it.
Is Amazon search volume the same as Google search volume?
No. Amazon search volume measures purchase-intent searches on the Amazon marketplace. Google search volume measures informational and navigational searches across the web. A keyword with high Google volume may have low Amazon volume and vice versa. Shoppers on Amazon search with buying intent. A query like “best wireless earbuds under $50” means they are ready to purchase. The same query on Google often indicates research. Sellers can explore the differences in amazon seo vs google seo to align their strategies.
Why do different tools show different search volume numbers for the same keyword?
Different tools use different estimation methods. Some rely on PPC impression extrapolation. Others use clickstream panels or Brand Analytics correlation. They also use different normalization approaches. No single tool has direct access to actual Amazon search data. The distinction between normalized unique shoppers and denormalized total search events accounts for the largest data discrepancies.
How often does Amazon search volume data update?
Most third-party tools update estimated search volume on a monthly basis. Brand Analytics Search Frequency Rank data is available weekly, biweekly, monthly, and quarterly through Seller Central for registered brands.
What is a good search volume for Amazon keywords?
It depends entirely on the product category. 500 monthly searches is excellent for industrial fasteners but completely irrelevant for phone cases. Sellers must build category-specific benchmarks using the top twenty keywords in their specific niche rather than relying on universal baseline metrics.
Can you get exact Amazon search volume for free?
Brand Analytics provides Search Frequency Rank for free to Brand Registered sellers. This provides a relative ranking of keyword popularity. For estimated absolute numbers, most tools require a paid subscription. Keywords.am offers a free Explore plan with full marketplace research access.
Conclusion
Navigating keyword volume data requires a shift in perspective. Sellers who understand the origins and limitations of these metrics gain a clear edge over competitors who simply chase the highest number on a screen.
- All Amazon search volume data is estimated. Treat every metric as directional guidance rather than absolute truth.
- Good volume depends entirely on the product category. Build specific benchmarks relative to a defined niche.
- Trends matter significantly more than snapshots. Use twelve months of historical data to identify seasonal and declining patterns.
- Cross-reference multiple data sources, including tool estimates, Brand Analytics, and active PPC campaigns, to establish higher statistical confidence.
Sellers ready to apply this framework need data that supports it. Keywords.am provides keyword volume metrics with historical trends across twenty-one Amazon marketplaces, category filtering, and the TFSD framework for placing keywords where they’ll have the most ranking impact. Try it with the free keyword research tool.