
📑 Table of Contents
- Why does Amazon niche validation fail for most sellers?
- What are the 5 keyword signals that validate an Amazon product niche?
- How does the 5-signal framework work on a real product niche?
- What red flags does keyword data reveal about a bad Amazon niche?
- How do you estimate revenue from keyword validation data?
- Frequently Asked Questions About Amazon Product Niche Validation
- Conclusion
⚡ TL;DR
- BSR and review counts are lagging indicators that obscure actual market demand.
- The 5-signal keyword framework evaluates search volume depth, intent, long-tails, overlap, and seasonality.
- A viable niche needs at least 30 keywords with over 300 monthly searches to provide adequate ranking paths.
- Competitor keyword overlap above 70 percent indicates a saturated market with little room for differentiation.
- Revenue estimation requires combining search volume, target position click-through rates, and conversion metrics.
- Two or more failing signals in the validation framework mean sellers should abandon the niche.
Most sellers validate niches by checking BSR and counting reviews. Then they wonder why their product fails despite “low competition.” Best Sellers Rank (BSR) tells sellers what is selling right now. It ignores whether a new entrant can actually capture those sales. The critical gap in Amazon product niche validation is understanding the keyword landscape underneath these surface-level metrics. Launching into a niche with one head keyword and 15 entrenched competitors is a direct path to dead inventory.
You need to dig past those surface metrics. The 5-signal keyword validation framework tests search volume depth, buying intent, long-tail availability, competitor keyword overlap, and seasonal patterns. Unlike general product research guides that treat keywords as an afterthought, this framework makes keyword data the primary validation lens. Many industry resources treat keyword research as step six out of nine. This approach places keyword analysis at the very beginning of the evaluation process.
Why does Amazon niche validation fail for most sellers?
Most Amazon niche validation fails because sellers rely on BSR and review counts without examining the keyword landscape that drives actual search demand and competition dynamics.
That BSR trap catches thousands of sellers every year. BSR tracks recent sales compared to other items in the same category. It doesn’t show total market demand. A product hitting rank 5,000 in Kitchen moves a totally different volume than one at rank 5,000 in Industrial supplies. Trusting that metric by itself leads to bad decisions. The official Amazon BSR documentation states clearly that ranking only tracks recent sales against other items in that exact category.
Review counts often hide the truth about an opportunity. Seeing fewer than 200 reviews might make a market look wide open. Reviews accumulate over long periods. Low reviews might mean a newly emerging niche. They might also indicate a dying product category. Search volume trends expose what’s really happening. Amazon product research tools that include keyword trend data help sellers uncover these underlying demand signals and avoid misinterpreting review scarcity.
Look at a typical $8,000 failure scenario. A seller sees a BSR under 10,000 and competitor reviews under 300. They order 500 units at $16 each. Post-launch reality sets in. The niche holds exactly one head keyword pulling 8,000 monthly searches. The top five competitors own 90 percent of those clicks. The inventory sits in an Amazon warehouse racking up storage fees. BSR proves products are selling right now. Keyword data reveals if a new seller can actually grab a piece of those sales.
What are the 5 keyword signals that validate an Amazon product niche?
The five signals are search volume depth, keyword intent distribution, long-tail availability, competitor keyword overlap, and seasonal demand stability. Together they reveal true niche viability.
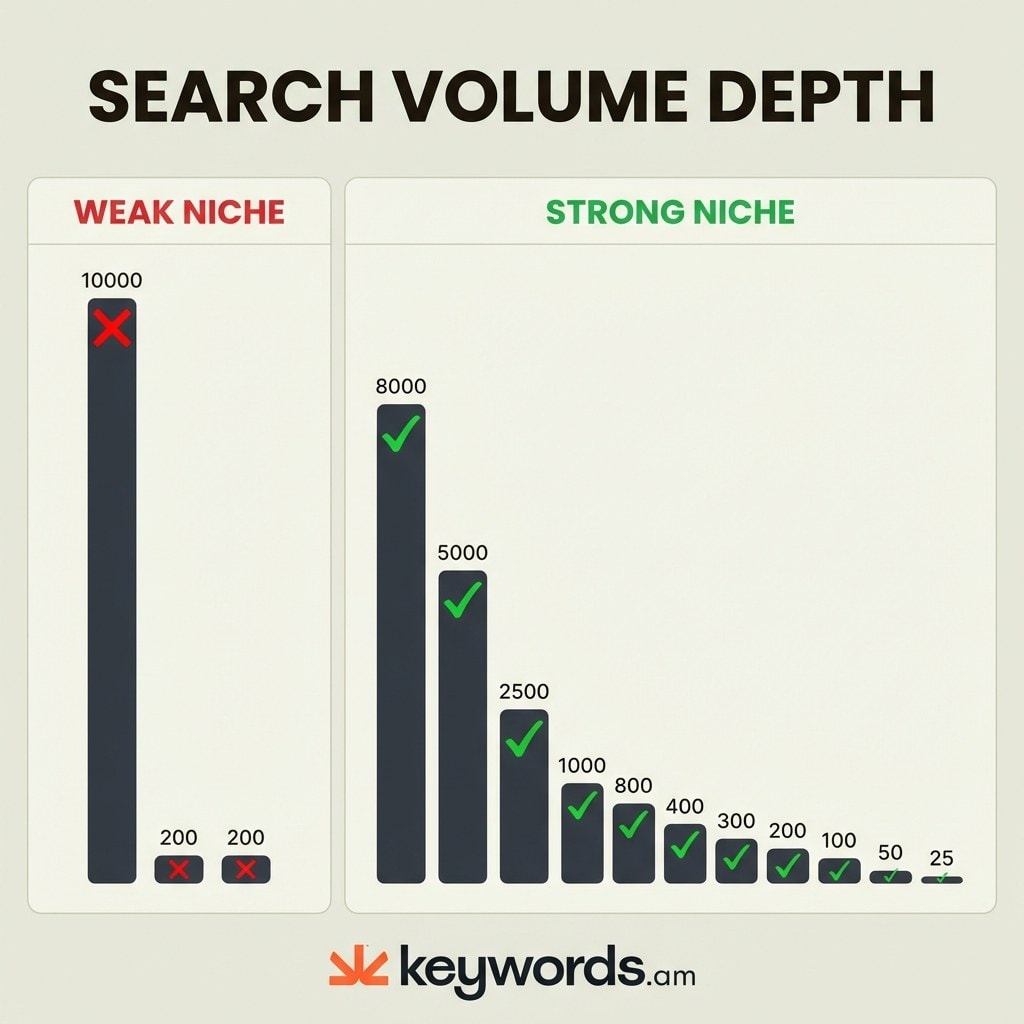
Signal 1: Search Volume Depth. A niche possessing 50 relevant keywords at 300 or more monthly searches is far more defensible than a niche relying on a single 10,000-search keyword. A deep pool gives you multiple ways to rank. Niches holding 50+ relevant keywords at 300+ monthly searches are 3x more likely to hold page-one rankings compared to niches with fewer than 10 keywords. Look at “silicone baking mats.” Run a keyword search and you’ll pull up around 45 terms that clear the 300-search threshold. That’s a deep pool. Now try “avocado slicer.” Three keywords, maybe. The top one gets 12,000 searches. The rest? They barely scratch 200.
Signal 2: Keyword Intent Distribution. The analysis determines what percentage of keywords signal buying intent compared to browsing intent. A search for “best silicone baking mat for macarons” screams buying intent. Someone typing “what is a silicone baking mat” is still browsing. Markets holding 60 percent or more buying intent will convert at a higher rate. Tools with scoring systems like the Keywords.am KPS feature help identify buying intent keywords and prioritize them for Amazon product niche validation.
Signal 3: Long-tail Availability. Sellers need to find 15 to 20 specific, low-competition long-tail keywords to target during the critical first 90 days. Products backed by rich long-tail landscapes rank easier during that initial launch window. Locking down 20 or more rankable long-tail terms gives a new listing instant indexing momentum. This forms the foundation of a successful Amazon product launch keyword strategy.
Signal 4: Competitor Keyword Overlap. Running a reverse ASIN lookup on the top five competitors reveals their exact traffic sources. When these competitors all rank for the exact same 20 keywords, the niche is saturated. When keyword overlap crosses 70 percent, you’re looking at a commoditized battlefield. But drop below 40 percent overlap and the picture changes. Each competitor is chasing different search terms, which means there’s actual space for a new product to carve out a position.
Signal 5: Seasonal vs Evergreen Demand. This one catches a lot of sellers off guard. Picture a niche averaging 6,000 monthly searches. Looks solid, right? But pull the monthly numbers apart and you might find 2,000 searches for 10 months straight, then a massive spike to 16,000 in November and December. The yearly average hides that most of the year, demand barely exists. And that’s exactly the kind of trap historical trend data catches before it costs real money.
Signal |
What It Measures |
Green Flag |
Red Flag |
|---|---|---|---|
Search Volume Depth |
Number of relevant keywords above 300 searches/month |
30+ keywords |
Fewer than 10 |
Intent Distribution |
% of keywords with buying intent |
60%+ buying intent |
Under 30% buying |
Long-tail Availability |
Rankable long-tail keywords (4+ words) |
20+ long-tails |
Under 10 |
Competitor Overlap |
Keyword similarity among top 5 ASINs |
Under 40% overlap |
Over 70% overlap |
Seasonal Stability |
Month-to-month search volume variance |
Under 30% variance |
Over 60% variance |
Breaking down each signal in isolation is the first step. But the real test? Running all five on the same niche at once. That’s where Amazon product niche validation gets practical.
How does the 5-signal framework work on a real product niche?
A worked validation of “magnetic phone mounts for car” demonstrates how each signal confirms or eliminates a niche before any inventory investment occurs.
Step 1: Search Volume Depth Check. Start by pulling every keyword tied to “magnetic phone mounts for car.” In this hypothetical, the search turns up 65 keywords clearing 300 monthly searches. “Magnetic phone mount for car” shows 14,000 searches. “Phone mount for car vent magnetic” shows 4,200. “Magnetic car phone holder” shows 3,800. That deep keyword pool gets a green flag. Volume spreads across dozens of terms instead of piling onto one impossible-to-win phrase.
Step 2: Intent Distribution. “Best magnetic phone mount for car” indicates buying intent. “How do magnetic phone mounts work” indicates browsing intent. The analysis shows 58 percent buying intent across the keyword pool. That result sits right on the borderline. But it passes. You have to target carefully during the keyword research methodology phase.
Step 3: Long-tail Scan. The data uncovers highly specific variations. “Magnetic phone mount for car that fits OtterBox case” pulls 1,200 monthly searches. “Magnetic phone mount for Tesla Model 3” shows 900. The research uncovers 24 distinct, rankable long-tail phrases. That pile of entry points gets a solid green flag. These phrases provide the initial ranking targets for the crucial early launch period.
Step 4: Competitor Overlap. Running a reverse ASIN search on the top five competitors reveals a 35 percent average keyword overlap. These competitors share about 15 core terms out of 43 unique keywords per listing. Every top seller runs a different keyword strategy. You have room to differentiate. That earns another green flag.
Step 5: Seasonal Check. The 12-month search trends show demand jumping 40 percent in November. Volume stays above 70 percent of the average year-round. That points to a slightly seasonal product. It doesn’t rely completely on Q4 sales to survive. That stable baseline demand secures the final green flag.
Verdict: Four green flags and one borderline result. This niche passes validation and moves to revenue sizing.
A passing validation tells sellers the niche has potential. But keyword data also reveals when a niche should be abandoned.
What red flags does keyword data reveal about a bad Amazon niche?
Keyword red flags include declining search trends, concentrated competitor rankings, brand-dominated head terms, and thin long-tail landscapes. Any two of these disqualify a niche.
Declining search volume trends require immediate abandonment. If the top 10 keywords show a 20 percent or greater year-over-year decline, overall demand is contracting. Listing optimization won’t fix shrinking search volume. Just walk away when the data points down.
Keyword cannibalization between competitors creates an impossible entry environment. When the top five ASINs all rank for the exact same 20 keywords and nothing else, the market offers zero room to differentiate. Keyword overlap above 70 percent signals commoditized competition. Every new seller battles for the exact same terms. Aggressive pricing and massive review counts become the only ways to stand out. A deep Amazon competitor analysis keeps sellers from falling into this saturated trap.
Brand dominance on head terms caps your visibility. When Amazon Basics or Anker locks down the top three spots across primary keywords, grabbing that top-tier traffic costs too much. Fighting massive brands head-on will bleed your PPC budget dry in days. Validating a niche means verifying enough mid-tail and long-tail terms remain open to support a launch.
A thin long-tail landscape suffocates new listings. Finding fewer than 10 rankable long-tail keywords means a product has almost no organic entry points. You’ll need constant PPC spending right out of the gate just to get eyes on the listing. Failing to target long-tail variations during the honeymoon phase kills your launch momentum entirely.
If a niche passes the red flag check, the final step is estimating what it is actually worth.
How do you estimate revenue from keyword validation data?
Sizing the revenue opportunity means plugging keyword search volumes into click-through rates at specific ranking positions, then layering in conversion rates and average selling prices.
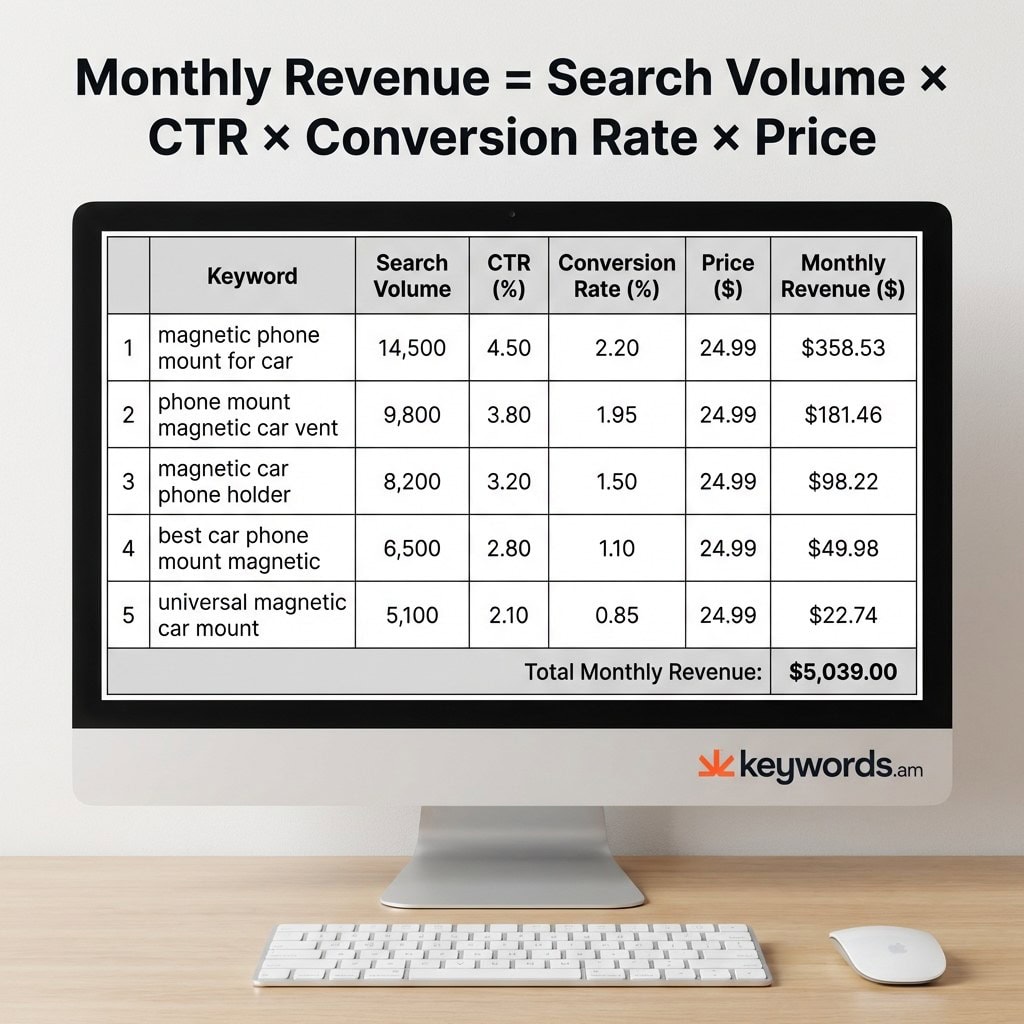
Here’s the formula, and it’s straightforward. Take keyword search volume, multiply by the click-through rate at whatever position you’re targeting, then factor in conversion rate and average selling price. What are realistic CTR numbers? Position one on Amazon captures around 27 percent of clicks. Drop to position five and you’re looking at 7 percent. Position ten? Just 3 percent. These aren’t perfect numbers, but they’re a much better starting point than guessing.
So what does this look like for the magnetic phone mount niche? Grab the top keywords from the validation. Plug in realistic CTRs. Amazon typically converts at 12 to 15 percent. At an $18.99 average selling price, the numbers start telling a clear story. The Amazon sales estimator methodology replaces blind guessing with mathematical probability.
Top sellers run both conservative and optimistic scenarios. Running the numbers at position five gives you a conservative baseline. Running them at position three sets an optimistic target. That approach generates a revenue range instead of one fragile number. Brand new products need to plan around that conservative scenario for the first six months.
The math sometimes reveals hidden failures. When position five generates less than $3,000 monthly and the product costs $8 to source, the math breaks down. The profit margin simply won’t cover the effort. Pushing a product to page one demands heavy ad spending. The Jungle Scout State of the Seller Report shows launch costs eating up 30 to 50 percent of early revenue. Tiny revenue pools just can’t fund those launch costs.
Keyword |
Monthly Searches |
Target Position |
CTR |
Conv. Rate |
ASP |
Monthly Revenue |
|---|---|---|---|---|---|---|
magnetic phone mount for car |
14,000 |
5 |
7% |
13% |
$18.99 |
$2,418 |
phone mount magnetic car vent |
4,200 |
3 |
12% |
14% |
$18.99 |
$1,340 |
magnetic car phone holder |
3,800 |
5 |
7% |
13% |
$18.99 |
$657 |
best magnetic phone mount |
2,600 |
8 |
4% |
15% |
$18.99 |
$296 |
car phone holder magnetic |
1,900 |
5 |
7% |
13% |
$18.99 |
$328 |
Total (top 5 keywords) |
$5,039/mo |
Note: These are hypothetical estimates based on the top 5 keywords. A complete set of 65 validated keywords would drive extra revenue through those long-tail terms.
Once validation passes and the revenue math works, the next step is building a keyword strategy for launch. Sellers can start testing these numbers using a free Amazon keyword tool to pull some initial data.
Frequently Asked Questions About Amazon Product Niche Validation
These are the most common questions sellers ask when validating Amazon product niches with keyword data.
How many keywords should a viable Amazon niche have?
Can sellers validate an Amazon niche with free tools?
What search volume is enough for a new Amazon product?
Should sellers enter a niche where Amazon Basics competes?
How long does proper niche validation take?
Conclusion
BSR and review counts are lagging indicators. Keyword data reveals the demand architecture underneath. Relying on surface metrics leads to expensive inventory mistakes. That’s where the 5-signal framework earns its keep. Run each check (search volume depth, intent distribution, long-tail availability, competitor overlap, seasonal stability) and the picture gets clear fast.
A single failing signal serves as a warning. Two or more failing signals means walk away. Keyword-based revenue math replaces “this feels like a good niche” with an actual dollar figure. That’s how you stop emotional product launches from burning through inventory capital.
Pick one product niche under evaluation. Run the search volume depth check today. Count the relevant keywords above 300 monthly searches. If there are fewer than 10, that niche has already failed. Use a free Amazon keyword tool to start running this validation right now. Once the data confirms viability, proceed to build an Amazon product launch keyword strategy to secure early rankings and build lasting momentum.