
📑 Table of Contents
- What does an Amazon sales estimator actually measure?
- Why do three estimator tools give three different numbers?
- Which Amazon sales estimator tools are worth using in 2026?
- How do you reconcile conflicting sales estimates?
- What is the missing piece most sellers overlook when estimating sales?
- What are the biggest mistakes sellers make with Amazon sales estimators?
- Frequently Asked Questions About Amazon Sales Estimators
- Conclusion
- References
⚡ TL;DR
- Estimators are approximations: No tool knows exact sales; they convert BSR to estimated units using algorithms with ~89% maximum accuracy.
- Triangulation is key: Never trust one number. Run three tools (e.g., Jungle Scout, Helium 10, AMZScout) and take the median to reduce error.
- BSR varies by category: A rank of #500 in Toys sells 10x more units than #500 in Industrial & Scientific.
- Seasonality matters: A single BSR snapshot is dangerous; track history over 30+ days to avoid overstocking based on peak-season data.
- Use the “Two-Lens” approach: Combine BSR data (what IS selling) with keyword search volume (what COULD sell) for complete validation.
- Free tools work: Amazon’s Product Opportunity Explorer and free estimators from SellerApp/ProfitGuru are sufficient for initial screening.
A product sits at Best Sellers Rank (BSR) 1,200 in the Kitchen category. Three different estimator tools provide three contradictory monthly sales estimates: 320, 480, and 610 units. Which number is correct? This scenario represents the daily reality for Amazon sellers attempting to validate product opportunities.
Sales estimators serve as a frequently utilized product research utility in the Amazon seller toolkit, yet the mechanics behind their operation remain largely misunderstood. Sellers often treat these estimates as absolute facts rather than the algorithmic approximations they are. According to a comprehensive study by Helium 10 involving 29,906 products across 32 categories, even the most sophisticated tools achieve only about 89% accuracy ^[ref-1]. This statistic implies that nearly every estimate carries a meaningful margin of error, potentially skewing financial projections for unwary sellers.
The discrepancy in data arises not from tool failure, but from distinct methodological approaches to data collection and modeling. This guide compares seven leading estimator tools, elucidates the reasons behind their diverging figures, and introduces a triangulation method for reconciling conflicting data points. It also reveals the critical component most sellers omit from their analysis: the integration of keyword search volume as a demand validation layer. By combining sales estimates with search volume data, sellers can move beyond simply knowing what is selling to understanding the full scope of market potential.
What does an Amazon sales estimator actually measure?
Sales estimators convert a product’s Best Seller Rank (BSR) into approximate monthly unit sales using category-specific conversion models built from historical sales data and tracking samples.
To effectively utilize an Amazon sales estimator, one must first grasp the underlying metric they interpret: the Amazon Best Sellers Rank (BSR). BSR is a relative ranking system, not an absolute measure of sales volume. It indicates how a product performs compared to others within the same category at a specific moment in time. For instance, a product ranked #1 in Toys & Games generates significantly higher unit sales than a product ranked #1 in Industrial & Scientific due to the vast difference in total category traffic and conversion volume. Amazon updates these rankings hourly, reflecting both recent and historical sales velocity ^[ref-2].
Estimator tools function by building conversion models that translate these relative rankings into concrete unit numbers. They achieve this by tracking a “truth set” of products (items for which the tool provider has verified sales data). By observing that a product in the Kitchen category with a stable BSR of 1,200 sells approximately 15 units per day, the algorithm extrapolates that other products with similar BSRs in that category will likely achieve similar sales figures.
However, the relationship between BSR and sales volume is non-linear. The sales difference between rank #50 and #100 is substantial, often representing hundreds of units, whereas the difference between rank #10,000 and #10,050 might be negligible. The top 1% of BSR positions capture a disproportionate share of total category sales, creating a steep curve that algorithms must model accurately. Because Amazon does not publicly release exact sales figures, every estimator is essentially a complex calculator making an educated prediction based on the correlation between rank and volume.
Understanding this mechanism explains why “exact” accuracy is impossible. A sudden spike in sales from a lightning deal can improve BSR immediately, but an estimator might not reflect that change until its next data crawl. Similarly, a product might hold a high BSR due to a recent giveaway campaign, misleading the algorithm into projecting sustained organic demand where none exists. The estimator measures the ranking, which is a proxy for sales, rather than counting the sales themselves.
Why do three estimator tools give three different numbers?
Sales estimators diverge because each tool uses different data sources, tracking sample sizes, update frequencies, and category models, producing legitimate but varying approximations of the same reality.
When three reputable tools provide estimates of 320, 480, and 610 units for the same product, it causes confusion. This variance is not necessarily a sign of inaccuracy but rather a reflection of different modeling methodologies.
Data Source Differences
Each tool provider maintains its own proprietary dataset. Jungle Scout, for example, relies on a massive panel of tracked products to inform its algorithms. Helium 10 utilizes its own distinct dataset comprising over 29,906 tracked products across 32 categories ^[ref-1]. AMZScout employs a third, independent methodology. Since no third-party tool has direct access to Amazon’s internal ledger, each must build its model based on the slice of the market it can observe. If Tool A’s sample set for “Pet Supplies” happens to include more high-velocity sellers than Tool B’s, their baseline curves for that category will differ.
Update Frequency
The frequency with which a tool updates its algorithms plays a significant role in estimation differences. Seasonality heavily impacts the BSR-to-sales ratio. In December, a rank of #1,000 in Toys might represent 3,000 sales/month. In March, that same rank of #1,000 might represent only 500 sales/month. If a tool updates its underlying model monthly, it will capture this shift. If it updates quarterly, it might apply a January multiplier to March data, resulting in a gross overestimation.
Category Granularity
Discrepancies also arise from how tools handle category hierarchies. Some estimators calculate sales based strictly on the top-level category (e.g., “Home & Kitchen”), while others factor in sub-category rankings. A product might rank #5,000 in the broad “Home & Kitchen” category but #1 in “Ice Cream Scoops.” An algorithm focused on the sub-category might project lower volume based on the niche’s limited size, while a top-level model might project higher volume based on the broad category’s traffic.
Accuracy Benchmarks
Independent testing highlights the practical impact of these differences. In comparative studies, Helium 10’s estimates averaged a variance of approximately 22 units from actual sales figures, while Jungle Scout’s estimates showed an average variance of roughly 35 units ^[ref-3]. Both tools claim accuracy rates falling between 60% and 89%, depending on the specific methodology and category tested. These margins confirm that while the tools are directionally useful, they are not precision instruments. For a seller operating with thin margins, a 35-unit difference in monthly sales volume could determine whether a product is profitable or a loss leader. For a deeper exploration of why data sources diverge and how to interpret them, refer to the analysis of Amazon data accuracy.
Which Amazon sales estimator tools are worth using in 2026?
The best sales estimator tools in 2026 include Jungle Scout, Helium 10 Xray, AMZScout, Amazon’s Product Opportunity Explorer, SellerApp, and ProfitGuru. Each offers different pricing, accuracy, and marketplace coverage.
Selecting the right tool involves balancing accuracy, cost, and the specific marketplaces a seller intends to target. The following comparison breaks down the most capable options currently available.
|
Tool |
Pricing |
Free Tier |
Marketplaces |
Best For |
|---|---|---|---|---|
|
Jungle Scout Estimator |
$49/mo (Suite) |
Free web tool (limited) |
US, EU, CA, MX, IN, JP, AU |
Most-cited, large tracking sample |
|
Helium 10 Xray |
$39/mo (Starter) |
Free Chrome extension (limited) |
US, EU, CA, MX, IN, JP, AU, BR |
Embedded in product pages, broad data |
|
AMZScout |
$49.99/mo or $499 lifetime |
Free web estimator |
US, EU, CA, MX, IN |
Budget option with lifetime plan |
|
Amazon Product Opportunity Explorer |
Free (Seller Central) |
Fully free |
Per-marketplace |
Official Amazon data, niche-level |
|
SellerApp |
Free estimator tool |
Free, unlimited |
US, EU, IN, JP, AU, CA, MX, BR, SG, AE |
No signup required, unlimited lookups |
|
ProfitGuru |
Free (basic) / $29.99/mo (Pro) |
Free estimator + Chrome extension |
US |
Historical BSR + price tracking |
Amazon Product Opportunity Explorer
This is the only tool on the list that utilizes actual first-party data from Amazon. Available for free to registered professional sellers within Seller Central, it provides niche-level demand data, search volume trends, and click share statistics. While it does not always provide a direct “units sold per ASIN” number in the same format as third-party tools, its data regarding niche volume is 100% accurate because it comes directly from the source ^[ref-4].
Jungle Scout Sales Estimator
Widely considered the industry standard for estimation, Jungle Scout offers a free web-based estimator for quick checks. Its full software suite, starting at $49/month, provides deeper analysis. The tool is renowned for its massive tracking sample and frequent model updates, which helps maintain accuracy across seasonal shifts ^[ref-5].
Helium 10 Xray
Part of the Helium 10 suite, the Xray Chrome extension overlays sales estimates directly onto Amazon product search results pages. It claims an 89% accuracy rate across 32 distinct categories, making it a favorite for sellers who want to validate ideas while browsing. The free tier offers limited queries but retains core functionality ^[ref-1].
AMZScout
AMZScout differentiates itself by offering a lifetime access plan for $499, avoiding the monthly subscription fatigue common in the industry. It provides a solid budget-friendly alternative for sellers who need consistent access to estimator data without recurring overhead.
SellerApp
SellerApp offers a completely free estimator tool that requires no account signup or login. It supports nine different marketplaces and allows for unlimited lookups. While less feature-rich than the paid suites, it is excellent for quick spot-checks and initial research ^[ref-6].
ProfitGuru
ProfitGuru focuses on the relationship between price and rank over time. Its free estimator and Chrome extension allow sellers to view historical BSR data alongside sales estimates. This context is vital for identifying whether a product’s current sales are stable or the result of a temporary spike ^[ref-7].
For a wider view of the software landscape, exploring the guide to the best Amazon seller tools can help contextualize where estimators fit. Additionally, understanding the broader Amazon analytics tools ecosystem is crucial for validating product research data beyond simple sales estimates.
How do you reconcile conflicting sales estimates?
Use the triangulation method: run three estimator tools on the same ASIN, discard outliers, take the median, then validate against keyword search volume.
Given the inherent variance between tools, relying on a single data point is a strategic error. The most effective way to approach estimation is through a process of triangulation, using multiple sources to locate the “true” range of sales.
Step 1: Run Three Tools
Select three distinct estimators from the list above. For a product with a BSR of 1,200 in Kitchen, you might input the ASIN into Jungle Scout, Helium 10, and AMZScout. Following the example from the introduction, assume you receive estimates of 320, 480, and 610 units per month.
Step 2: Take the Median
Identify the middle value. In this set (320, 480, 610), 480 is the median. The outlier of 610 might be calculating based on a peak season multiplier, while 320 might be missing recent velocity data. The median serves as the safest baseline. If the numbers were 320, 340, and 610, you would discard the 610 entirely as an anomaly and average the two closer figures.
Step 3: Apply Category Context
Verify if the median estimate aligns with general category norms. A BSR of 1,200 signifies different volumes in different categories. The reference table below provides a sanity check for these approximations.
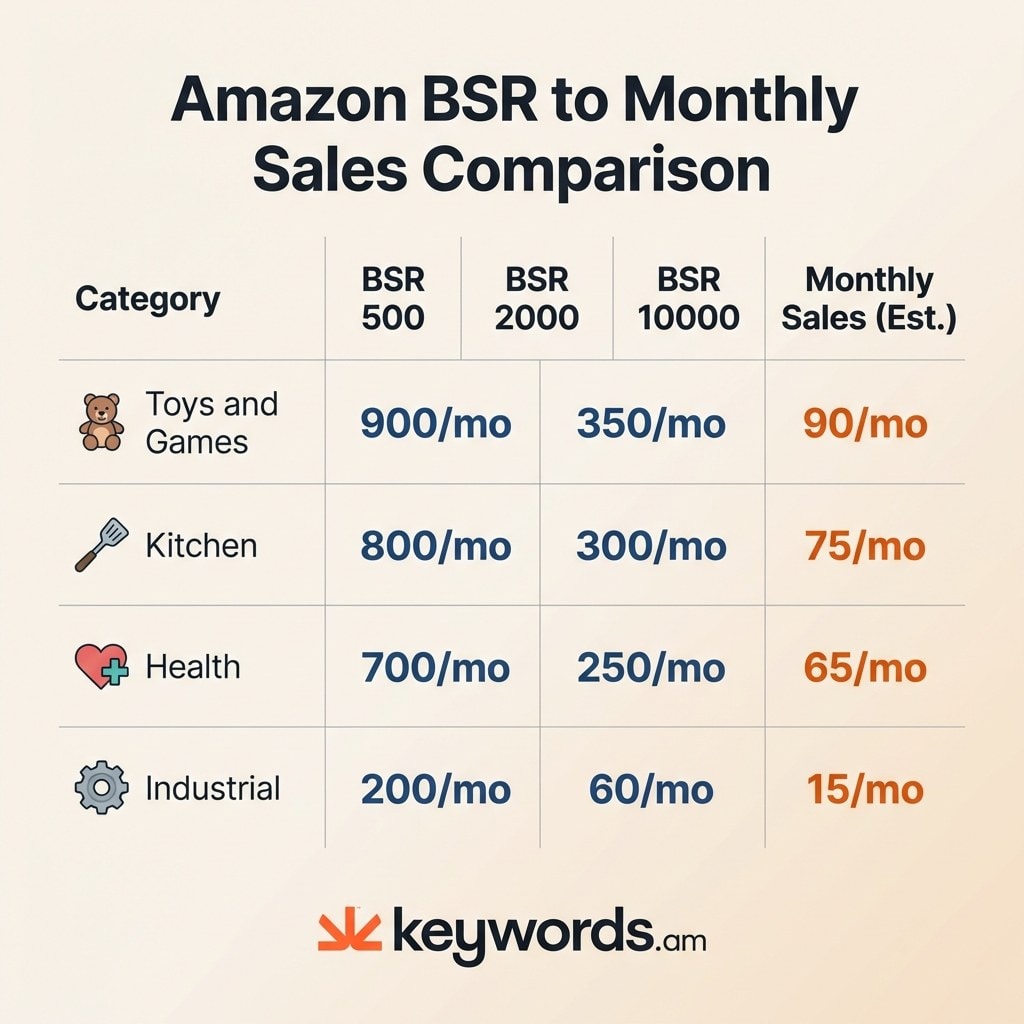
Approximate Monthly Unit Estimates by BSR and Category
|
Category |
BSR 500 |
BSR 2,000 |
BSR 10,000 |
BSR 50,000 |
|---|---|---|---|---|
|
Toys & Games |
~900/mo |
~350/mo |
~90/mo |
~20/mo |
|
Kitchen & Dining |
~800/mo |
~300/mo |
~75/mo |
~15/mo |
|
Health & Household |
~700/mo |
~250/mo |
~65/mo |
~12/mo |
|
Industrial & Scientific |
~200/mo |
~60/mo |
~15/mo |
~3/mo |
Note: These figures are approximate ranges for illustration. Actual numbers vary by sub-category and season.
If your median estimate for a Kitchen product at BSR 2,000 is 480, and the reference table suggests ~300, you should proceed with caution. The product might be in a high-velocity sub-niche, or the estimate might be aggressive. Always err on the side of the conservative estimate for financial planning.
Step 4: Check BSR Stability
A single estimate represents a snapshot in time. If a product’s BSR oscillates wildly, jumping between 2,000 and 50,000 over the course of a week, any single sales estimate is effectively meaningless. Tools like ProfitGuru and Keepa allow sellers to view the BSR history chart. A product with a stable average rank provides a reliable basis for estimation; a volatile product does not. If the BSR graph looks like a heartbeat monitor, the “monthly sales” figure is a theoretical average that may never actually occur in a single month.
What is the missing piece most sellers overlook when estimating sales?
BSR-based estimates show what IS selling now, but keyword search volume reveals what COULD sell. Combining both gives sellers a complete demand picture.
The fundamental limitation of all sales estimators is that they are backward-looking. They analyze history, representing purchases that have already happened. This data confirms that a market exists, but it fails to quantify the potential of that market. It is akin to reading a weather report for yesterday rather than a forecast for tomorrow. The missing piece of the equation is unfulfilled demand, which can only be measured through keyword search volume.
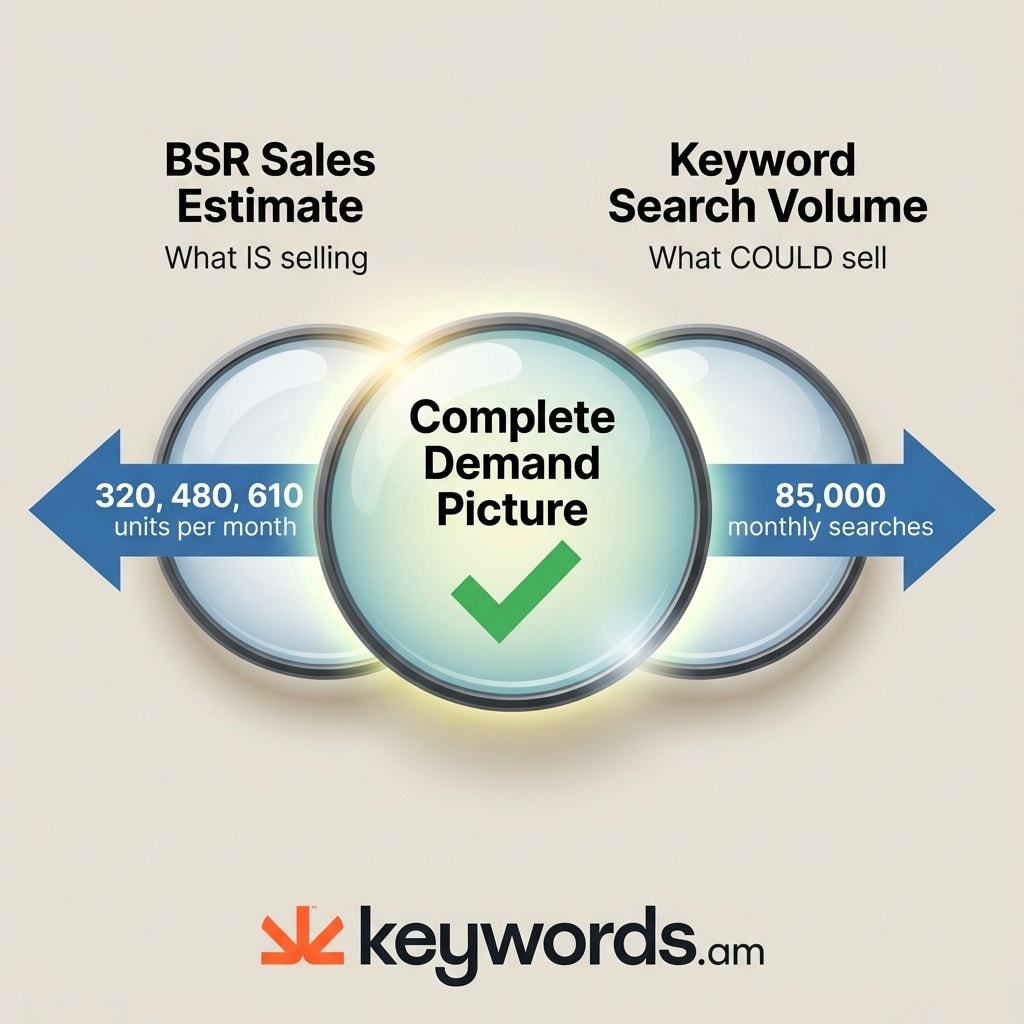
Consider a product showing estimated sales of 400 units per month, with a BSR of roughly 3,000 in Kitchen. On the surface, this appears to be a moderate opportunity. However, a deeper analysis using keyword research might reveal that the top five search terms driving traffic to that niche generate a combined monthly search volume of 85,000.
This discrepancy reveals a critical insight. If 85,000 customers are searching, but the leading products are only selling 400 units, the conversion rate from search to sale is abysmal. This “demand gap” suggests one of two things: either the existing products are failing to satisfy customer needs (a prime opportunity for a better product), or the search intent is mismatched (a warning sign). Without the keyword data, a seller sees only “400 sales” and misses the broader context.
The Two-Lens Framework
To accurately validate a product, sellers must employ a two-lens approach. This aligns with the Amazon keyword research methodology known as the TFSD framework, which emphasizes understanding demand depth.
1. Lens 1 (BSR → Sales Estimate): What IS selling? This metric validates proof of concept. It confirms that customers are willing to pay for this type of product.
2. Lens 2 (Keyword Search Volume): What COULD sell? This metric measures total addressable interest. It indicates the ceiling for potential sales if a product perfectly meets customer needs.
Tools such as Amazon’s Brand Analytics, Helium 10’s Magnet, and Keywords.am provide this second layer of visibility. By cross-referencing sales estimates with search volume, sellers can identify “high interest, low satisfaction” niches, representing the holy grail of private label sourcing. A sales estimator tells you how big the pie is today; keyword data tells you how big the pie could be if you brought a better knife.
What are the biggest mistakes sellers make with Amazon sales estimators?
The four biggest estimator mistakes are trusting a single tool, ignoring BSR seasonality, treating estimates as exact numbers, and skipping keyword demand validation.
Even with access to premium tools, sellers frequently misinterpret data, leading to costly inventory miscalculations. Avoiding these common pitfalls is as important as finding the right numbers.
Mistake 1: Trusting a single tool
As established, no estimator exceeds roughly 89% accuracy. Basing a $5,000 inventory order on a single data point from one tool is a gamble, not a business decision. The variance between tools is a feature, not a bug; it highlights the uncertainty range. Sellers who fail to triangulate verify their bias rather than the market reality.
Mistake 2: Ignoring seasonality
New sellers often analyze a product in November or December and assume the sales volume is permanent. A toy selling 2,000 units in December might struggle to move 300 units in February. Extrapolating peak-season BSR to an annual forecast ensures a warehouse full of stagnant inventory. Always review historical BSR charts to identify seasonal baselines before committing to a product.
Mistake 3: Treating estimates as exact numbers
Sellers often build profit calculators using precise estimates: “If I sell 423 units…” This false precision is dangerous. “400 units/month” should be interpreted as “likely between 300 and 500 units/month.” Financial models must be robust enough to remain profitable at the lower end of that range. Estimates are for go/no-go validation and competitive benchmarking, not for precise cash flow planning.
Mistake 4: Skipping keyword demand validation
Relying solely on BSR confirms only the status quo. It tells a seller that a competitor is successful, but not why or if there is room for another player. Neglecting to analyze keyword search volume leaves a seller blind to the actual size of the customer base. A high-sales product with low search volume might be driven by external traffic (ads, influencers) rather than organic Amazon demand, a distinction that is fatal to miss.
Frequently Asked Questions About Amazon Sales Estimators
These are the most common questions sellers ask about Amazon sales estimator accuracy, pricing, and how to interpret conflicting data from different tools.
Q1: How accurate are Amazon sales estimator tools?
Most tools achieve 60-89% accuracy depending on the category, with an average variance of 22-35 units from actual monthly sales for mid-range BSR products.
Accuracy varies significantly by category size and BSR range. Tools are generally more accurate for products in the BSR 1,000-50,000 range and less accurate for very high BSR (low-selling) products where small sales changes cause large BSR swings ^[ref-1] ^[ref-3].
Q2: Can sales estimators predict sales for new products?
No, they cannot predict new product sales because they rely on existing BSR data, and new products have no BSR history to analyze.
For new product validation, sellers should use keyword search volume data and competitor sales estimates for similar existing products to model potential demand. Product Opportunity Explorer also shows niche-level demand independent of individual product BSR.
Q3: How often should sellers check BSR when estimating sales?
Sellers should track BSR over at least 30 days before making sourcing decisions, checking weekly minimum, because single BSR snapshots are unreliable and seasonal fluctuations distort estimates.
Tools like Keepa and ProfitGuru provide BSR history charts. A product with a stable BSR between 2,000-3,000 over 90 days is a much safer bet than one bouncing between 1,000 and 20,000.
Q4: What is the difference between BSR and actual sales volume?
BSR is a relative ranking within a product category updated hourly, while actual sales volume is the absolute number of units sold. BSR #5,000 means very different unit sales in different categories.
BSR #5,000 in Toys & Games might represent 150+ units/month, while BSR #5,000 in Industrial & Scientific might represent only 20 units/month. Category size and competition level determine the BSR-to-sales conversion ratio.
Q5: Are free estimator tools reliable enough for product research?
Free versions from Jungle Scout, SellerApp, and ProfitGuru provide useful directional estimates for initial screening, but sellers should cross-reference multiple tools before committing capital.
Free tools are sufficient for narrowing down a list of 50 product ideas to 10 worth deeper analysis. For final sourcing decisions involving significant capital, use the triangulation method (3+ tools) and validate against keyword search demand data.
Conclusion
No single Amazon sales estimator is perfectly accurate; triangulation across multiple tools combined with keyword search volume produces the most reliable demand validation.
Navigating the landscape of Amazon product research requires recognizing that no single tool holds the absolute truth. The divergence in numbers provided by sales estimators is a reflection of the complex, dynamic nature of the marketplace itself.
- Imperfection is standard: No single sales estimator is more than ~89% accurate. The most reliable data comes from the triangulation method: running three distinct tools and identifying the median value.
- Context implies volume: BSR is relative. A rank of #500 represents vastly different revenue potential in Toys compared to Industrial categories.
- Combine lenses for clarity: Sales estimates are backward-looking records of what has sold. Keyword search volume is forward-looking evidence of what could sell. Combining these two metrics creates a complete demand picture.
- Start with free tools: Utilities like Product Opportunity Explorer, SellerApp, and ProfitGuru offer sufficient power for initial screening, while paid suites offer the depth required for tracking and monitoring.
For an immediate sanity check, pick one product currently under evaluation. Run its ASIN through three different estimator tools discussed above. Calculate the median estimate. Then, examine whether the top search terms for that product’s niche show stable or growing volume. This simple ten-minute exercise will provide a more rigorous validation of market potential than any single BSR number ever could.
To truly understand the “could sell” side of the equation, explore Keywords.am to access the keyword search volume data that serves as the essential second lens for demand validation.
References
These industry sources were used to verify accuracy claims, BSR conversion models, and marketplace data throughout this article.
- ^[ref-1]: Helium 10 Accuracy Study
- ^[ref-2]: Amazon BSR Algorithm Update
- ^[ref-3]: Independent Accuracy Testing
- ^[ref-4]: Amazon Product Opportunity Explorer
- ^[ref-5]: Jungle Scout Sales Estimator
- ^[ref-6]: SellerApp Free Sales Estimator
- ^[ref-7]: ProfitGuru Sales Estimator