
📑 Table of Contents
- What Does the Amazon Brand Analytics Top Search Terms Report Show?
- How Is the Top Search Terms Report Different from Search Query Performance?
- How Does Search Frequency Rank Work (and What Do the Ranges Mean)?
- How Do Click Share and Conversion Share Reveal Hidden Opportunities?
- How Do Sellers Export and Analyze 100,000+ Rows of TST Data?
- The TST + SQP Combo Workflow That Finds Gaps Competitors Miss
- Frequently Asked Questions About Amazon Brand Analytics Top Search Terms
- Conclusion
⚡ TL;DR
- TST shows marketplace-wide data: The Top Search Terms report reveals what all Amazon shoppers search for, not just your brand’s performance.
- SFR is a ranking, not volume: Search Frequency Rank measures relative popularity. Lower number = more searched.
- Click share + conversion share = action plan: Combining these metrics reveals whether listings need more traffic or better conversion.
- Filter before you export: Narrowing by category and SFR under 50,000 isolates actionable keywords from millions of rows.
- TST + SQP together: Cross-referencing high-demand terms against your brand’s Search Query Performance data reveals the highest-priority optimization targets.
SQP tells you how your brand performs. TST tells you what the market wants. The Amazon Brand Analytics top search terms report contains marketplace-wide search intelligence that most sellers never touch. Search popularity rankings, click share data, and conversion metrics for millions of keywords sit waiting for analysis.
Most sellers either ignore this data or confuse it with Search Query Performance. Reading the top search terms data correctly changes how you prioritize keyword optimization across every listing.
This guide covers SFR interpretation ranges, a click share opportunity matrix for finding gaps, and a TST+SQP combo workflow that connects market demand to listing performance.
What Does the Amazon Brand Analytics Top Search Terms Report Show?
The Top Search Terms report ranks the most popular search terms across Amazon, with click share and conversion share for the top three products per term.
Seller Central hides massive market intelligence in plain sight. Access to this data requires a Professional selling plan and active enrollment in Amazon Brand Registry. Locate the dashboard by navigating to Brands, selecting Brand Analytics, and clicking into Search Analytics. Amazon’s official Brand Analytics documentation describes the full access requirements.
The report outputs three critical metrics for millions of queries. Search Frequency Rank dictates relative keyword popularity. Click share shows the percentage of total clicks captured by specific products. Conversion share reveals the percentage of purchases won by those same items. Amazon displays this data for the top three most-clicked ASINs per search term.
Sellers can pull this information daily, weekly, monthly, or quarterly. Weekly reporting offers the most actionable cadence because it smooths out daily anomalies while catching trends faster than monthly roll-ups. Filtering by specific product categories keeps the dataset relevant.
The Amazon Brand Analytics top search terms report covers all search terms entered by customers across the entire platform. It does not limit itself to queries where your brand already appears. This is pure marketplace intelligence rather than isolated performance tracking. But TST is not the same as the other Brand Analytics report most sellers know. The confusion between these two datasets is the biggest barrier to using TST effectively.
How Is the Top Search Terms Report Different from Search Query Performance?
TST shows marketplace-wide search popularity and which products customers click for any search term. SQP shows how your specific brand performs within searches where your products appeared.
Sellers lose money by conflating market research with performance tracking. Comparing these two distinct reports highlights their unique roles in any optimization strategy.
Feature |
Top Search Terms (TST) |
Search Query Performance (SQP) |
|---|---|---|
Scope |
Marketplace-wide |
Your brand only |
Who it tracks |
All sellers |
Your brand catalog |
Primary metric |
Search Frequency Rank |
Query Volume and Impressions |
Click data |
Top 3 ASINs globally |
Your specific brand share |
Conversion data |
Top 3 ASINs globally |
Your specific brand share |
Best for |
Market research and discovery |
Performance tracking |
TST answers what customers search for. SQP answers how your brand performs in those specific searches. These reports function as two sides of the same coin. Use one to find the target and the other to measure accuracy.
A comprehensive Search Query Performance guide details how to leverage your brand’s specific funnel metrics. SQP helps diagnose whether you lose customers at the impression, click, add-to-cart, or purchase stage. TST helps you figure out if you are even targeting the right keywords to begin with. Now that the distinction is clear, the most important TST metric to understand is Search Frequency Rank. Most sellers interpret this metric wrong.
How Does Search Frequency Rank Work (and What Do the Ranges Mean)?
Search Frequency Rank is a relative popularity ranking where 1 equals the most searched term on Amazon, measuring how popular a term is compared to all others.
The most common mistake sellers make with SFR is treating it like search volume. SFR is an ordinal ranking, not a count. An SFR of 1 belongs to the single most popular search term on the platform for that time period. An SFR of 1,000,000 indicates an obscure query.
Understanding what these numbers mean in practice requires benchmarking. Based on analysis of Brand Analytics data across seller accounts, the following interpretation ranges provide a practical framework for the amazon brand analytics top search terms report.
SFR Range |
Interpretation |
Example |
Strategic Action |
|---|---|---|---|
1 to 1,000 |
Massive volume, head terms |
“phone case” |
Extremely competitive. Monitor for market shifts. |
1,000 to 10,000 |
Strong volume, category terms |
“leather phone case” |
Winnable with strong budgets. Core targets. |
10,000 to 50,000 |
Moderate niche terms |
“iphone 15 leather case brown” |
Sweet spot for mid-size sellers. High focus. |
50,000 to 200,000 |
Long-tail intent terms |
“brown leather case with card holder” |
Lower competition, higher conversion potential. |
200,000+ |
Emerging or hyper-specific terms |
“handmade vegan leather slim case” |
Ideal for new product launches. |
SFR fluctuates weekly because Amazon recalculates it relative to every other term on the site. A keyword’s rank can drop from 5,000 to 15,000 without losing a single actual search. This happens because other terms grew faster during that period. Monitoring your Amazon seasonal keyword strategy accounts for these relative shifts during holidays and seasonal transitions.
Tracking SFR requires a systematic approach. Export the data weekly, log the rank for priority targets in a spreadsheet, and watch for sustained directional movement. Remember the counterintuitive direction: a lower SFR number means higher popularity. Popularity alone does not reveal opportunity though. For that, sellers need click share and conversion share data.
How Do Click Share and Conversion Share Reveal Hidden Opportunities?
Click share shows the percentage of clicks a product receives for a search term. Conversion share shows the percentage of purchases. Comparing both reveals traffic problems versus conversion problems.
Metrics without context lead to poor decisions. Click share defines what percentage of total clicks on a search term went to a specific ASIN. Conversion share shows what percentage of total purchases from that term went to the ASIN.
If ASIN B001 captures 25 percent click share and 40 percent conversion share for “wireless earbuds,” it performs well above average. One-quarter of the traffic but nearly half of the sales means a listing that converts at almost twice its click rate. Comparing these two metrics exposes clear strategic actions.
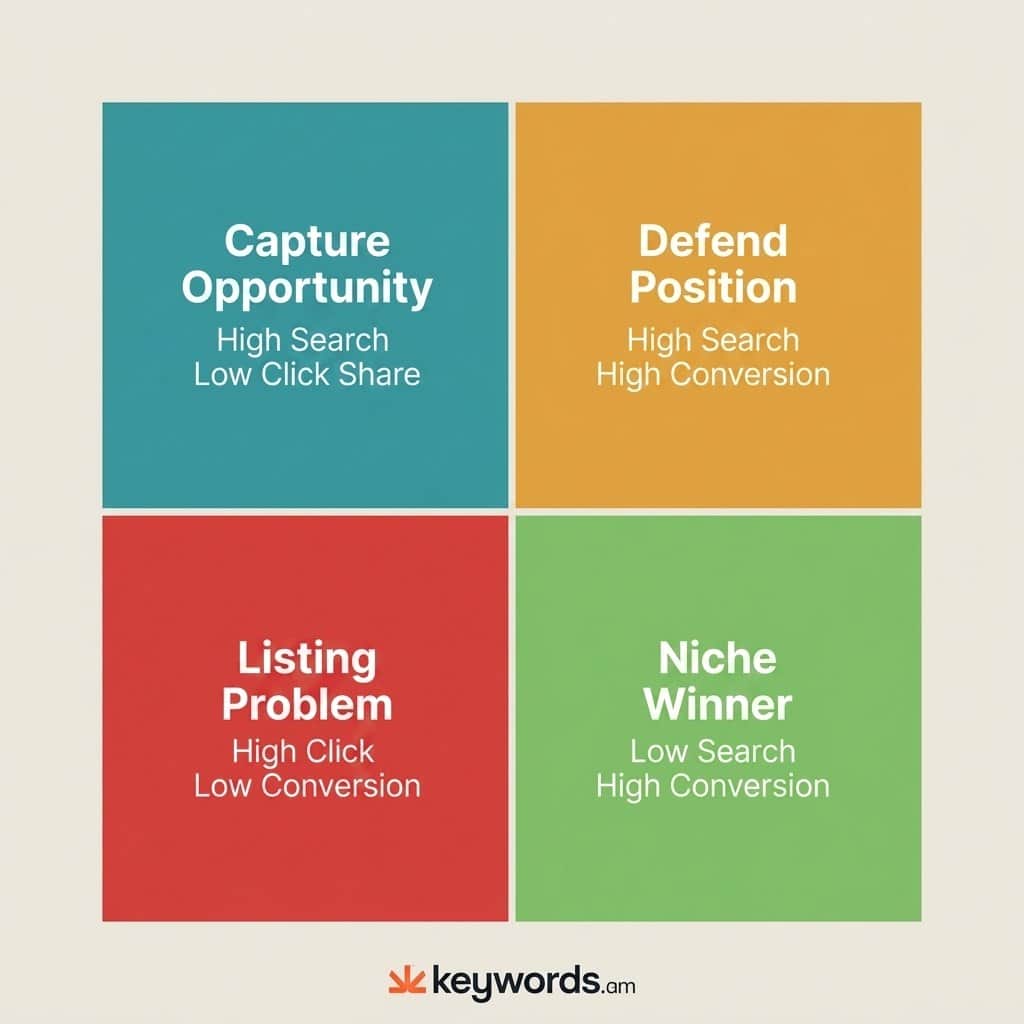
Quadrant |
Data Profile |
Strategic Action |
|---|---|---|
Capture Opportunity |
High SFR + Low Click Share |
Improve listing images, main title, and CTR elements. Demand exists but shoppers scroll past. |
Listing Problem |
High Click Share + Low Conversion Share |
Fix pricing, review scores, or product descriptions. Customers click but don’t buy. |
Defend Position |
High SFR + High Conversion Share |
Maintain ranking aggressively. Monitor competitors entering this space. |
Niche Winner |
Low SFR + High Conversion Share |
Find adjacent long-tail keywords. Strong performance in a small audience needs expansion. |
Finding your products in this data requires precision. Filter the report by your brand name or specific ASIN to see which keywords feature your items in the top three positions. If your ASIN doesn’t appear, your product sits outside the top 3 for click share on that term. This highlights keyword difficulty and signals a need for deeper competitor analysis. Understanding the data is step one. Step two requires building a repeatable system for extracting and analyzing it.
How Do Sellers Export and Analyze 100,000+ Rows of TST Data?
Sellers export TST data as CSV from Brand Analytics, then filter by category and SFR range to isolate actionable keywords from the 100,000+ row dataset.
Downloading raw CSV files yields overwhelming data. A standard amazon brand analytics top search terms export routinely exceeds hundreds of thousands of rows. Most sellers open the file, scroll randomly, and close it. Narrowing the scope before exporting is what separates useful analysis from wasted time.
Follow this systematic export process:
- Open Seller Central and navigate to Brands, then Brand Analytics.
- Select the Top Search Terms report under Search Analytics.
- Set the date range to weekly reporting.
- Apply the category filter to match your specific product niche.
- Download the filtered CSV file.
Filtering by category before clicking export trims the dataset down to a manageable size. Once the CSV is open, apply a strict filtering methodology:
- Exclude SFR above 50,000. This removes ultra-niche terms with minimal business impact.
- Sort by click share to spot keywords where major competitors dominate.
- Cross-reference against your current keyword list to find gaps. Use keyword clustering to organize the gaps by intent.
Build a lean tracking spreadsheet. Log SFR, click share, and conversion share weekly for 20 to 30 priority keywords. This focused approach reveals macro trends without drowning in noise. A thorough keyword research methodology relies on consistency, not volume.
For sellers managing brand analytics search terms at scale, Keywords.am’s Brand Analytics integration automates the export-and-compare workflow, pulling TST data automatically and cross-referencing it against indexed keywords.
The manual export workflow gives sellers raw TST data. The next step combines it with SQP to reveal the full picture.
The TST + SQP Combo Workflow That Finds Gaps Competitors Miss
The combo workflow uses TST to find high-demand keywords, then checks SQP to measure your brand’s share for those same terms, revealing where demand exists but listings underperform.
Combining datasets reveals actionable gaps. Looking at marketplace demand without checking brand performance yields incomplete theories. Looking at brand performance without understanding marketplace demand creates an echo chamber. The most successful sellers run a three-step combination workflow.
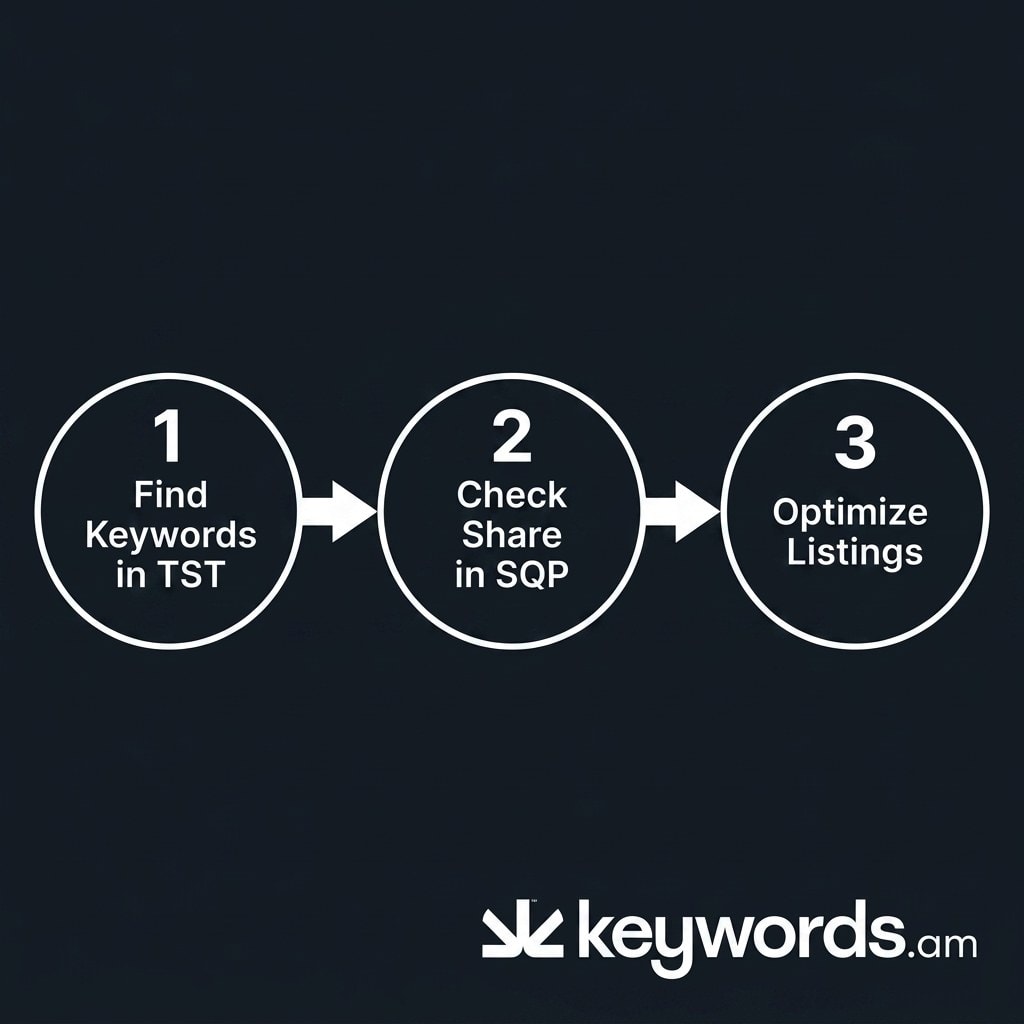
Step 1: Identify high-SFR keywords in TST.
Filter your Top Search Terms data for keywords with an SFR under 10,000 in your product category. These represent the high-demand queries your target market actively cares about. For example, you find “wireless earbuds with mic” sitting at an SFR of 4,500.
Step 2: Check your brand share in SQP for those keywords.
Take that exact keyword and look it up in your Search Query Performance report. Review your brand’s impression share, click share, and purchase share. You discover your brand holds just a 3 percent click share for “wireless earbuds with mic.” According to Amazon’s Brand Analytics overview, both reports refresh on the same cadence, making side-by-side comparison straightforward.
Step 3: Optimize listings for gaps.
This contrast creates an immediate optimization priority. The TST data proves high market demand. The SQP data proves low market capture. Deploy the TFSD Framework to place that specific keyword strategically across your title, bullet features, backend search terms, and product description.
This combination approach separates sellers who guess at keywords from those who know exactly where market demand exceeds their capture rate. It turns two static reports into a competitive intelligence system. Read the complete Search Query Performance guide to map out the other half of this strategy.
Frequently Asked Questions About Amazon Brand Analytics Top Search Terms
These are the most common questions sellers ask about the top search terms brand analytics report and how to use it effectively.
Conclusion
The Amazon Brand Analytics top search terms report provides deep visibility into Amazon shopper behavior. Mastering this data prevents optimizing in a vacuum.
- TST and SQP serve different purposes. Market intelligence versus brand performance. Use both, not one.
- SFR is a ranking, not volume. Practical interpretation ranges make it actionable instead of abstract.
- The 2×2 click share and conversion share matrix shows the next move. It reveals whether a keyword needs more traffic or better conversion.
- Combining TST with SQP creates a data-driven keyword prioritization system. This is the workflow that separates guessing from knowing.
Export your weekly TST data right now. Filter it to your category, sort by SFR, and identify 10 keywords where your brand has zero presence in the top 3 clicked products. For the other half of Brand Analytics, read the Search Query Performance companion guide. To automate TST analysis, explore Keywords.am’s Brand Analytics integration.