
📑 Table of Contents
- What Is Amazon ACoS (and How Do You Calculate It)?
- How Does ACoS Compare to ROAS and TACoS?
- What Is a Good Amazon ACoS by Category?
- How Do You Calculate Your Break-Even ACoS?
- Why Is ACoS a Keyword Problem (Not a Bid Problem)?
- How Do You Lower Amazon ACoS With Better Keywords?
How to Build a Portfolio ACoS Strategy Across Multiple Campaign Types
Most sellers optimize ACoS at the campaign level. The sellers consistently running 23–26% ACoS optimize at the portfolio level — managing ACoS targets differently across campaign types, product lifecycle stages, and keyword intent tiers.
A single blanket ACoS target applied to every campaign is a profitability trap. A new product launch campaign and a mature bestseller campaign should never share the same ACoS goal. The math behind each is fundamentally different.
ACoS Targets by Campaign Type and Product Stage
Campaign TypePurposeTarget ACoSWhyBroad/Auto (discovery)Find new converting termsAbove break-even acceptableData collection phase — profitability is secondary to search term discoveryExact match (scale)Scale proven converters60–75% of break-even ACoSKnown-good terms should carry the heaviest budget at efficient targetsCompetitor ASIN targetingSteal share from rivalsAt or above break-evenLower CVR expected — these shoppers chose a competitor firstLaunch campaigns (new ASIN)Build ranking velocity150–200% of break-evenDeliberate investment to gain review velocity and initial keyword rankingDefense campaigns (brand terms)Protect branded keywordsUnder 15%Brand term CVR is highest — low ACoS here subsidizes discovery spendThe TACoS Bridge: Connecting ACoS to Business Health
ACoS tells you how efficient each campaign is. TACoS (Total ACoS = Ad Spend ÷ Total Revenue) tells you how dependent the entire business is on paid traffic.
A healthy TACoS trajectory looks like this: launch at 25–35% TACoS (heavy PPC investment to build rank), then watch TACoS fall to 10–18% as organic rank improves and organic revenue grows without additional ad spend. If TACoS is not declining over 90 days while ACoS stays stable, it means PPC is generating sales but not building organic rank — a sign of keyword targeting problems.
The relationship between ACoS and TACoS reveals whether advertising is working as a rank-building engine or just as a direct sales channel. Products with efficient keyword targeting see TACoS decline as organic rank climbs. Products with broad, unfocused keyword targeting see TACoS stay flat — paying for every sale indefinitely.
The Bid Reduction Trap: Why Lower Bids Hurt Long-Term ACoS
When ACoS spikes, the instinctive response is to lower bids. This creates a counterproductive cycle that many sellers never escape:
- ACoS spikes → seller lowers bids → ad impressions drop → sessions decline
- Lower sessions reduce Amazon’s conversion signals for the ASIN
- Organic rank drops over 2–3 weeks due to lower velocity signals
- Organic sales fall, so total revenue drops even though ACoS improves momentarily
- TACoS rises because organic volume is now lower, requiring more ad spend to compensate
Bid reduction is appropriate only when the search terms themselves are misaligned — broad match casting too wide, auto campaigns serving irrelevant queries. The correct response to high ACoS from relevant keywords is keyword-level optimization, not blanket bid cuts.
Sellers running the TFSD framework — optimizing title, features, search terms, and description together — see ACoS improve across all three inputs simultaneously. Conversion rate improves (lower CVR means fewer wasted clicks), CTR improves on the main image (lower CPC per converted click), and keyword relevance sharpens (lower cost per click over time as relevance scores improve).
ACoS Recovery Checklist After a Spike
- Pull search term report: Identify which specific terms drove the ACoS increase — broad match or auto campaigns generate the most waste
- Add new negative keywords: Block irrelevant search terms bleeding budget without converting
- Move top converters to exact match: Isolate proven terms and bid them aggressively at a profitable target
- Check listing conversion rate: If Unit Session Percentage is below category average, the listing is the bottleneck — not the bids
- Run TFSD audit: Misaligned title keywords or weak feature bullets silently suppress conversion for every ad click
- Review competitor pricing: A 10% price disadvantage can reduce CVR enough to push ACoS 8–12 points higher with no listing change required
Frequently Asked Questions About Amazon ACoS
- Conclusion
⚡ TL;DR
- Average Amazon ACoS: Sits around 30% in 2026. Top sellers maintain an efficient 23-26% range.
- Bids aren’t the fix: Lowering bids only reduces visibility. Fixing keyword targeting improves all ACoS inputs at once.
- Break-even ACoS: Equals your pre-ad profit margin. Profitable campaigns target 60-70% of that number.
- Three inputs drive ACoS: Cost per click (CPC), click-through rate (CTR), and conversion rate (CVR) — all shaped by keywords.
- Mine your search term report: Grouping keywords by shopper intent reveals high-converting targets hiding in plain sight.
- Optimize listings too: The TFSD framework raises conversion rates, which pushes ACoS down.
The average Amazon ACoS hit 30% in 2025. Projections for 2026 push it to 32-35%. Most sellers respond by lowering bids. That treats the symptom, not the cause.
ACoS keeps climbing because average cost per click (CPC) is up 12% year-over-year. Most sellers target the same broad keywords everyone else targets. Bidding wars escalate. Profit margins shrink.
This guide covers the formula, 2026 benchmarks by category, and break-even calculations. You’ll learn why keyword strategy — not bid strategy — is the real lever for lower ACoS.
What Is Amazon ACoS (and How Do You Calculate It)?
Amazon ACoS (Advertising Cost of Sale) measures what percentage of ad revenue goes to ad spend, calculated as Ad Spend ÷ Ad Revenue × 100.
Here’s the math. A campaign spends $200 and generates $1,000 in sales — that’s a 20% ACoS. For every dollar earned, 20 cents went to advertising.
One thing to keep in mind: ACoS only tracks paid channel efficiency. It doesn’t account for organic sales or total business health. Think of it as a snapshot of your ad dollars in isolation.
Lower ACoS means more efficient ads, but chasing the lowest possible number isn’t always smart. Growth campaigns run higher on purpose to grab market share. A campaign could hit 10% ACoS while strangling total sales volume. The real challenge? Balancing efficiency with scale — and that starts with understanding the alternatives.
How Does ACoS Compare to ROAS and TACoS?
ACoS measures ad spend as a percentage of ad revenue. ROAS is the inverse (revenue per dollar spent). TACoS includes total revenue, making it the better long-term health metric.
These three acronyms get mixed up constantly. They actually serve different purposes, and knowing the difference helps you pick the right metric for each stage of your campaign.
|
Metric |
Formula |
What It Measures |
Best For |
|---|---|---|---|
|
ACoS |
Ad Spend ÷ Ad Revenue × 100 |
Ad efficiency (% of revenue spent) |
Campaign-level optimization |
|
ROAS |
Ad Revenue ÷ Ad Spend |
Return per ad dollar |
Comparing across platforms |
|
TACoS |
Ad Spend ÷ Total Revenue × 100 |
Ad dependency (total business) |
Long-term business health |
ROAS is just the mathematical inverse of ACoS — a 20% ACoS equals 5x ROAS. Amazon shows both in the advertising console. If you’re coming from Facebook or Google Ads, ROAS probably feels more natural. Amazon-native sellers tend to stick with ACoS for granular campaign-level optimization.
TACoS (Total Advertising Cost of Sale) takes a wider view — it divides total ad spend by total revenue, organic sales included. The key insight: if your ACoS ticks up a bit but TACoS drops over time, your ads are successfully building organic visibility. That’s the flywheel working. For a deeper look, check out the TACoS guide.
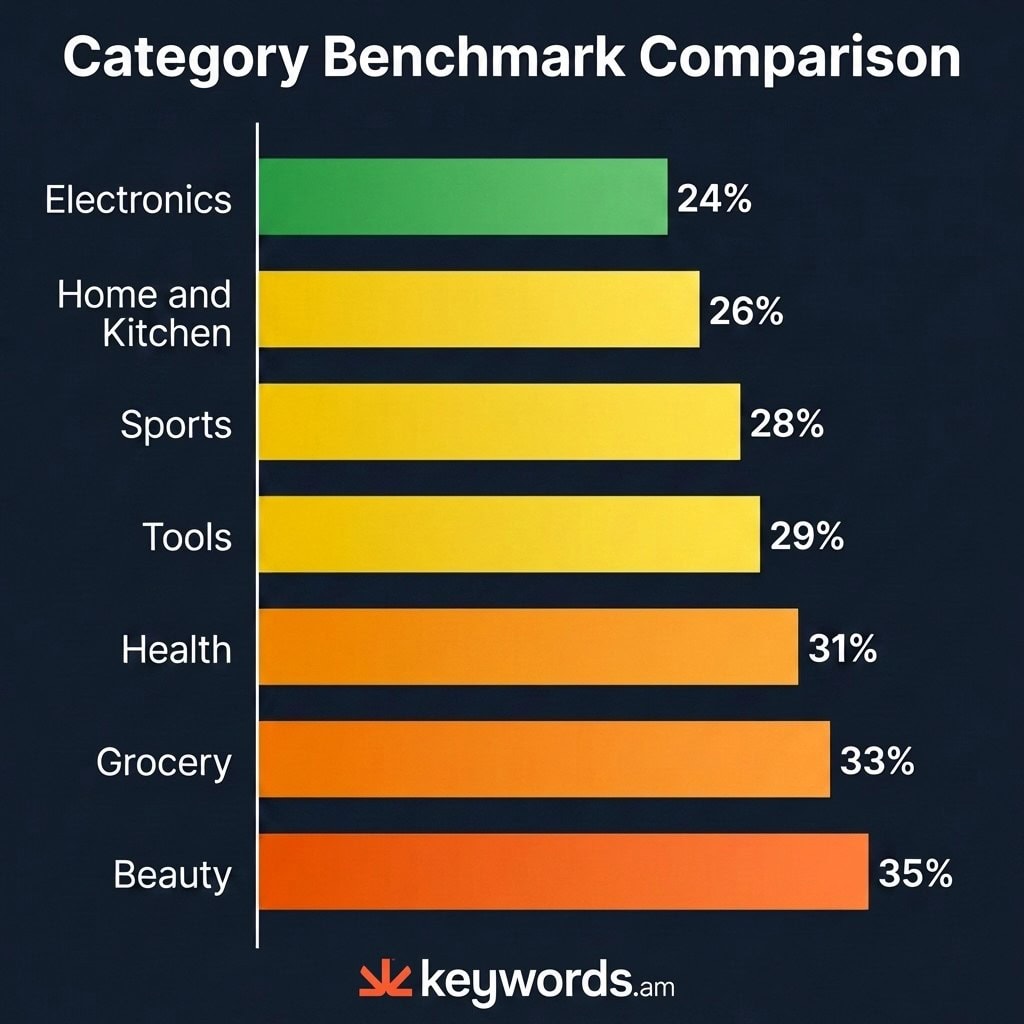
What Is a Good Amazon ACoS by Category?
A good Amazon ACoS depends on category. Electronics averages 24%, Home and Kitchen 22-30%, Beauty 30-40%, and the overall Amazon average sits around 30% in 2026.
These averages tell you where the market sits — but context matters. Competition in your specific category dictates how much acquiring a customer actually costs. There’s no point comparing a supplement brand’s ACoS to a niche toy seller’s numbers.
|
Category |
Average ACoS |
CPC Range |
Notes |
|---|---|---|---|
|
Electronics |
~24% |
$1.35-$1.60 |
Most efficient major category |
|
Home & Kitchen |
22-30% |
$1.00-$1.18 |
Wide range by sub-niche |
|
Beauty & Personal Care |
30-40% |
$1.45-$1.55 |
High competition, impulse buys |
|
Supplements/Health |
28-35% |
$2.50-$4.00+ |
Highest CPCs on the platform |
|
Sports & Outdoors |
20-28% |
$0.80-$1.20 |
Seasonal swings |
|
Grocery & Gourmet |
25-35% |
$0.70-$1.10 |
Lower CPC but lower margins |
|
Toys & Games |
~27% |
$0.90-$1.30 |
Competitive in Q4 |
|
Overall Average |
~30% |
$1.12-$1.18 |
Top performers: 23-26% |
The sellers hitting 23-26% ACoS get there through precise keyword targeting and strong listing conversion. Keep in mind these are year-round averages — expect Q4 to inflate everything by 30-50% when bidding wars peak.
Here’s the catch, though: benchmarks only get you so far. Your margins determine whether a specific ACoS number works or doesn’t. A 35% ACoS could bankrupt a thin-margin wholesale reseller while generating healthy profits for a private label brand with favorable manufacturing costs.
How Do You Calculate Your Break-Even ACoS?
Break-even ACoS equals your profit margin before ad spend. If your margin is 30%, any ACoS below 30% generates profit on each ad-attributed sale.
It’s simpler than most people expect: take your selling price, subtract COGS and Amazon fees, and the leftover margin percentage is your break-even ACoS.
|
Scenario |
Selling Price |
COGS + Fees |
Pre-Ad Margin |
Break-Even ACoS |
Target ACoS (profit) |
|---|---|---|---|---|---|
|
Low margin |
$25.00 |
$20.00 |
20% |
20% |
12-15% |
|
Mid margin |
$35.00 |
$24.50 |
30% |
30% |
18-22% |
|
High margin |
$50.00 |
$25.00 |
50% |
50% |
30-35% |
Most profitable campaigns sit at 60-70% of break-even. Why not target exactly break-even? Because that leaves no room for actual profit. A product with a 30% break-even point does well at a 20% target — leaving a 10-point cushion for daily swings in conversion or CPC spikes.
Launch campaigns are the exception. New products often run above break-even intentionally, trading short-term losses for ranking momentum. Once organic positions solidify, sellers dial bids back toward their profitable target.
Why Is ACoS a Keyword Problem (Not a Bid Problem)?
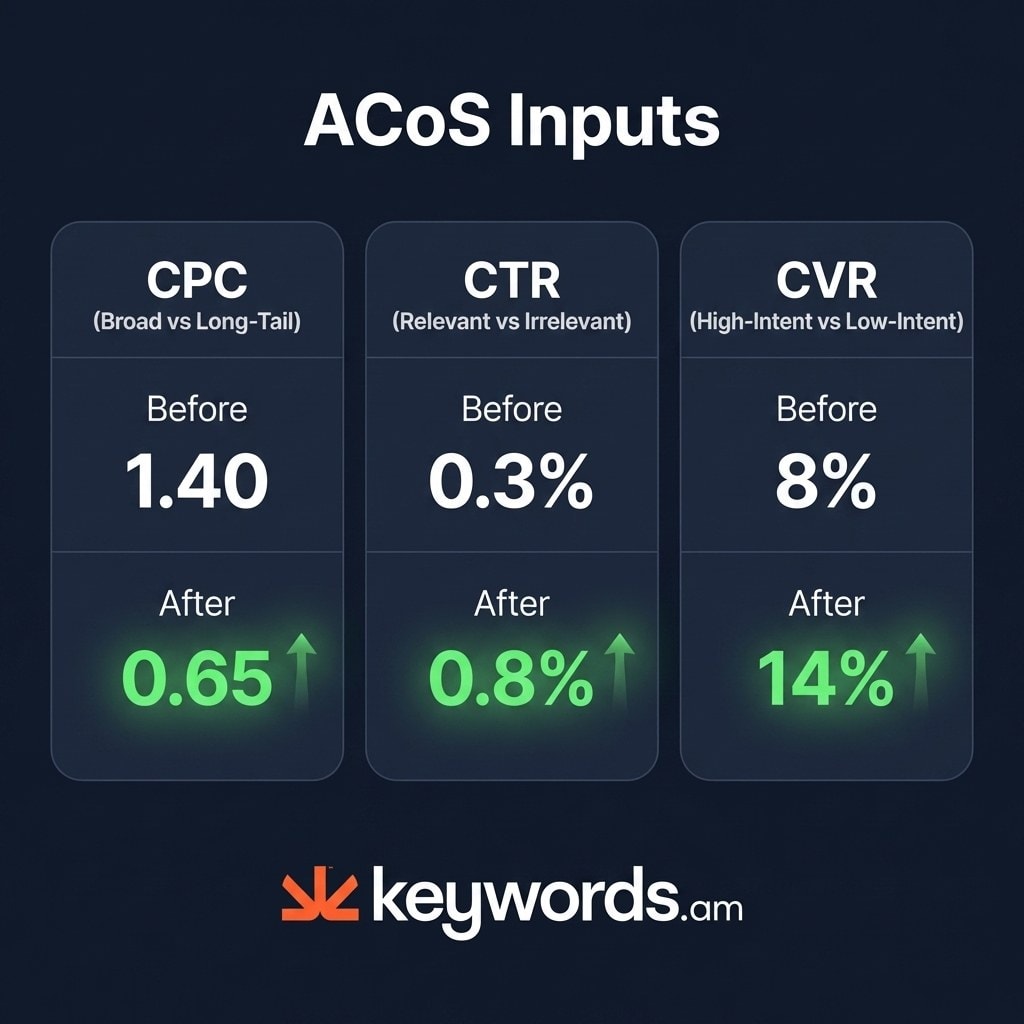
ACoS has three inputs — cost per click, click-through rate, and conversion rate. All three are determined by which keywords you target, not how much you bid.
When ACoS climbs, most sellers reach for the bid slider. That only touches one variable. A keyword-driven PPC strategy goes after all three at once.
Here’s how each input ties back to keyword choice:
- CPC (Cost Per Click): The keywords you bid on determine your cost. Broad head terms can run several dollars a click. Specific niche phrases? A fraction of that.
- CTR (Click-Through Rate): Relevance matters. If your keywords don’t match what the shopper wants, your ad shows up in front of the wrong people — and click-through rates tank.
- CVR (Conversion Rate): Intent alignment is everything here. Someone searching “stainless steel water bottle 32oz” is far more likely to buy than someone typing “water bottle.”
Slashing bids lowers CPC, sure — but it does so by cutting visibility. Better keywords fix the foundation without sacrificing reach.
Here’s what this looks like in practice (hypothetical but realistic): targeting “yoga mat” means a $1.40 CPC, 0.3% CTR, and 8% CVR. Switch to “extra thick yoga mat 6mm” and CPC drops to $0.65, CTR jumps to 0.8%, CVR hits 14%. ACoS plummets — without adjusting a single bid.
How Do You Lower Amazon ACoS With Better Keywords?
Lower ACoS by mining search term reports for converters, building negative keyword lists, targeting long-tail terms, clustering by intent, and optimizing listings with TFSD.
Five keyword strategies make the difference between profitable accounts and budget sinkholes. Here’s each one in practice.
1. Mine the search term report for high-converting terms
There’s a gap most sellers miss: search terms show what buyers actually typed, while keywords are what you bid on. Those two things aren’t always the same. Digging into your search term report shows which actual phrases generate real sales. Take those proven winners and move them into exact match campaigns — this isolates your top performers from broad match bleed.
2. Build negative keyword lists proactively
Every irrelevant click costs you money and raises your overall ACoS. The fix? Don’t wait for bad data to pile up. Build negative keyword lists before you even launch new campaigns. Block competitor brand names you can’t convert against, and block materials or features your product doesn’t offer. Wasted spend drops fast.
3. Target long-tail keywords with purchase intent
Short queries usually mean browsing. Longer, more specific queries? Those signal someone ready to buy. Long-tail keywords naturally carry lower CPCs and stronger conversion rates. “Shoes” won’t do much for your ad efficiency. But “men’s black running shoes size 10” — that’s a buyer. Shift budget accordingly.
4. Cluster keywords by intent to match ad groups
Most sellers group keywords by how similar the words look. That breaks ad relevance. The smarter move: group by shopper intent. Keyword clustering done right means your ad copy actually answers what the shopper is looking for. Better alignment lifts both CTR and CVR — and both push ACoS down.
5. Optimize listing copy with TFSD so ads convert at higher rates
None of this matters if the listing itself doesn’t convert. Better titles, sharper feature bullets, optimized search terms, and clearer descriptions raise conversion for every click — paid or organic. The TFSD Framework turns this into a repeatable process, optimizing each listing element so ad dollars actually produce returns. When conversion goes up, ACoS comes down.
Frequently Asked Questions About Amazon ACoS
These are the most common questions sellers ask about ACoS.
Conclusion
If there’s one takeaway from this guide, it’s this: Amazon ACoS is a keyword signal, not a bid dial. Lowering bids treats the symptom. Fixing your keyword targeting addresses the cause. Category benchmarks give you a starting point; break-even ACoS gives you your actual financial threshold.
Every strategy above attacks all three ACoS inputs at once — CPC, CTR, and CVR. Pair that keyword work with listing optimization through the TFSD framework and the effect compounds.
Here’s what to do next: pull your search term report, sort by ACoS descending, and move the top five converting terms into exact match campaigns today. Need better targeting data? Try this free keyword tool to find high-intent phrases your competitors haven’t caught onto yet.