PPC
Best Amazon Advertising Budget Split: SP vs SB vs SD by Stage (2026)
Amazon advertising budget allocation explained: SP vs SB vs SD splits by lifecycle stage, revenue tier benchmarks, and a monthly rebalancing checklist.
A seller spending $3,000 per month on the right campaign types routinely outperforms one spending $10,000 spread evenly across all three. Allocation matters more than total spend.
Most PPC budget guides explain how much to spend but skip the harder question: where to put it. The 60/30/10 rule shows up on every agency blog, yet nobody explains when to break it. This article covers lifecycle-stage allocation matrices, revenue-tier sizing, campaign-type benchmarks, and a monthly rebalancing checklist.
Why does Amazon advertising budget allocation matter more than total spend?
Budget allocation determines which shoppers see ads at which stage of the purchase funnel, making it the single biggest lever for ROAS improvement.
Concentrating dollars where they generate the highest return compounds over time. A $5,000 monthly budget split 80/10/10 across SP, SB, and SD during a product launch targets discovery keywords, the campaigns with the highest conversion potential for new ASINs. When a listing lacks organic ranking history and reviews, visibility on high-intent search terms acts as the primary sales engine.
That same $5,000 split 33/33/33 wastes a third of the budget on brand awareness for a product nobody recognizes yet. The high-converting discovery campaigns run out of budget by noon while Sponsored Brands video ads feed impressions to cold traffic that won’t convert. Understanding the Amazon PPC campaign structure prevents this common capital drain.
TACoS (Total Advertising Cost of Sale) measures total ad spend relative to overall account revenue, not just ad-attributed sales. Tracking Amazon TACoS confirms whether aggressive budget concentration drives real account growth instead of cannibalizing organic sales.
What is the 60/30/10 Amazon advertising budget framework?
The 60/30/10 framework allocates 60% of the ad budget to Sponsored Products, 30% to Sponsored Brands, and 10% to Sponsored Display as an industry starting point.
This distribution reflects where conversions actually happen. Sponsored Products campaigns drive 75 to 80 percent of ad-attributed sales for most sellers because they target shoppers actively searching with purchase intent. Building a strong Amazon Sponsored Products keyword strategy capitalizes on this bottom-of-funnel traffic by placing listings directly in front of buyers ready to purchase.
Sponsored Brands receives the next 30% to build brand awareness and capture category share. Video ad formats fill mobile screens, while headline search banners position product portfolios at the top of desktop results. A focused Amazon Sponsored Brands keyword strategy helps established listings defend territory and cross-sell complementary items.
Sponsored Display takes the final 10% for remarketing to previous page visitors and competitor product targeting. For sellers launching their first product, Amazon Sponsored Display targeting ranks as the lowest immediate priority.
This framework is a default baseline, not a permanent strategy. If keyword data says otherwise, follow the data.
| Campaign Type | Budget Share | Primary Role | Typical ACoS | Typical ROAS |
|---|---|---|---|---|
| Sponsored Products | 60% | Keyword-driven conversions | 15-25% | 3.5-6.5x |
| Sponsored Brands | 30% | Brand awareness + category share | 20-35% | 2.8-5x |
| Sponsored Display | 10% | Retargeting + competitor targeting | 25-40% | 2.5-4x |
When should sellers deviate from 60/30/10? The answer depends on where the product sits in its lifecycle.
How should budget allocation change by product lifecycle stage?
Budget allocation should shift from SP-heavy during launch toward a balanced SB and SD mix as products mature and brand recognition grows.
A static budget split fails because the needs of a new listing look nothing like the defensive needs of a category leader. Adjusting the blend by maturity stage keeps capital aligned with the right objectives.
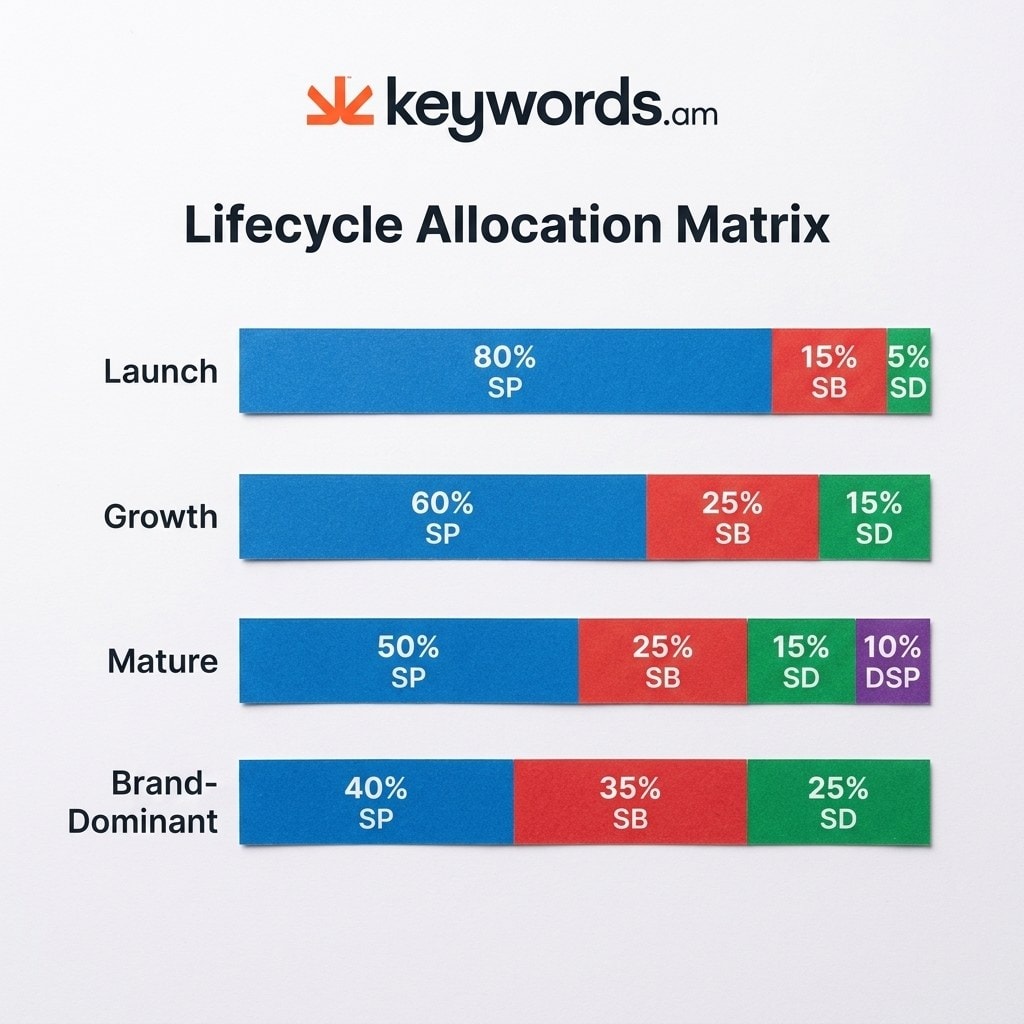
Product Launch (First 90 days)
The recommended split is 80% SP / 15% SB / 5% SD. New products need keyword-driven discovery to build sales velocity and generate early reviews. Shoppers have zero brand recognition at this stage, so heavy SB investment underperforms.
Growth Phase (Months 3-12)
Once a listing crosses the 100-review threshold and gains organic traction, the split moves to 60% SP / 25% SB / 15% SD. Branded search terms start generating volume. The remarketing audience grows large enough to make Sponsored Display viable.
Mature Product (12+ months)
Established products require 50% SP / 25% SB / 15% SD / 10% DSP. Brand defense becomes critical as new competitors try to steal market share. Competitor conquesting via SD grows in priority. Amazon DSP becomes a viable addition for brands reaching peak market penetration.
Brand-Dominant Category
When competitors bid on branded terms, allocation shifts to 40% SP / 35% SB / 25% SD. Sponsored Brands banners at the top of search results prevent rivals from intercepting loyal buyer traffic.
Seasonal Ramp
During Prime Day or Q4, shift 15-20% of budget from SB and SD back into SP. An effective Amazon seasonal keyword strategy demands aggressive funding for high-intent exact match terms when marketplace traffic spikes.
| Lifecycle Stage | SP | SB | SD | DSP | Key Priority |
|---|---|---|---|---|---|
| Launch (0-90 days) | 80% | 15% | 5% | - | Keyword discovery |
| Growth (3-12 months) | 60% | 25% | 15% | - | Category share |
| Mature (12+ months) | 50% | 25% | 15% | 10% | Brand defense |
| Brand-dominant | 40% | 35% | 25% | - | Brand protection |
| Seasonal peak | +15-20% | -10% | -5-10% | - | Conversion volume |
Lifecycle stage sets the template. Determining daily dollar amounts requires looking at total business revenue.
How much should sellers spend on Amazon advertising by revenue tier?
Most Amazon sellers allocate 10 to 20 percent of revenue to advertising, with the percentage decreasing as revenue grows and organic sales increase.
Clear dollar parameters prevent sellers from overextending cash flow or starving growth engines prematurely. The relationship between ad spend and total revenue shifts as a brand scales.
| Monthly Revenue | Ad Budget Range | TACoS Target | Daily Budget |
|---|---|---|---|
| $10K-$50K | $1,500-$5,000/mo | 15-20% | $50-$165 |
| $50K-$200K | $5,000-$20,000/mo | 10-15% | $165-$660 |
| $200K+ | $20,000+/mo | 8-12% | $660+ |
Sellers generating under $10,000 in monthly revenue should start campaigns at $500 to $1,500 per month. Running 20-30% TACoS remains acceptable during a product launch. High early spend buys market share and builds ranking history.
Category dynamics also influence these targets. Amazon Ads benchmarking data shows dietary supplements running at 20-35% ACoS due to intense competition and high customer lifetime value. Electronics typically see 15-22%, while Home and Kitchen products land between 22-30%. Checking Amazon ACoS benchmarks by category keeps spending aligned with industry reality rather than guesswork.
Budget sizing provides the total ceiling. The real competitive advantage comes from using keyword performance data to direct where every dollar goes.
How does keyword data drive smarter ad budget allocation?
Search term reports and keyword performance data reveal which campaign types deserve more budget based on actual conversion patterns, not generic rules.
Following a fixed percentage split without checking performance data guarantees wasted spend. Raw conversion metrics provide proof of what shoppers want and where they click.
High-converting keyword clusters deserve more SP budget
When search term reports show keyword groups converting well below the target ACoS, those clusters deserve dedicated SP campaigns with higher daily budgets. If “organic dog treats grain free” converts at 12% ACoS while the account target is 25%, create a dedicated campaign for that term and boost its daily budget by 20-30%. Pulling an Amazon search term report weekly identifies these breakout opportunities before competitors notice.
Brand terms under attack need SB defense
If competitors launch bidding attacks on branded search terms, shifting budget toward Sponsored Brands becomes a defensive necessity. Headline search ads dominate the top of desktop results and provide the strongest visual barrier against rivals stealing bottom-of-funnel conversions. A detailed Amazon Sponsored Brands keyword strategy covers brand defense tactics in depth.
Weak competitor listings create SD opportunities
Reverse ASIN analysis reveals competitors with poor keyword coverage or weak listings. Increasing budget for Amazon product targeting places ads directly on their listing pages. A strong listing foundation multiplies this effect. The TFSD Framework guide improves base conversion rates, making every ad dollar stretch further against weaker competitors.
Wasted spend becomes reallocated budget
Diligent Amazon negative keywords management saves 10-15% of a monthly PPC budget by eliminating clicks that never generate sales. That recovered capital flows directly into winning campaigns.
Keywords.am’s search term analysis and keyword clustering surface which keyword groups convert profitably, feeding directly into campaign budget decisions without manual spreadsheet work.
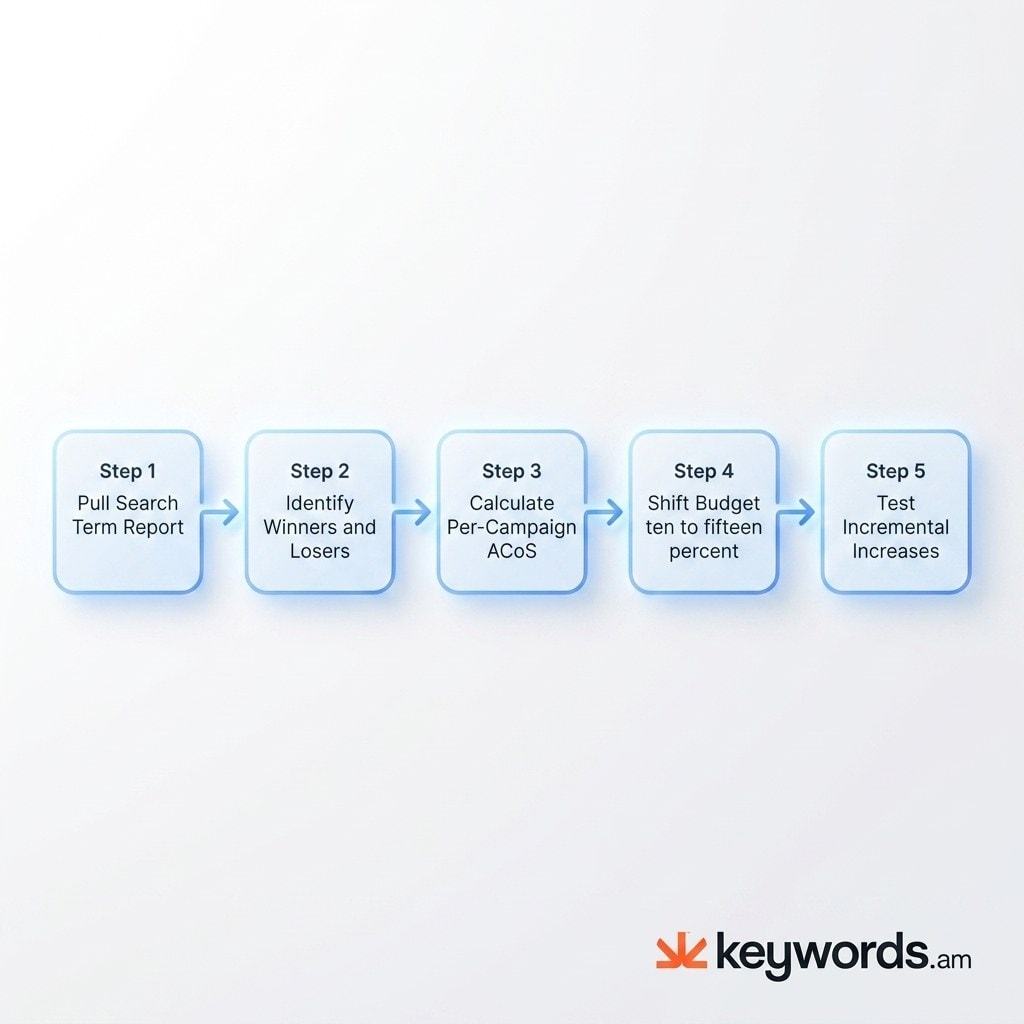
What does a monthly Amazon advertising budget rebalancing checklist look like?
Monthly budget rebalancing follows five steps: pull performance data, identify winners and losers, calculate per-campaign ACoS, shift budget, and test incremental increases.
A set-and-forget approach guarantees margin erosion over time. The marketplace shifts constantly, and ad budgets need to adjust in response to changing search volumes, new competitor bids, and shifting buyer behavior.
- Pull the search term report covering the previous 30 days. Ignore the last 48 hours to account for Amazon’s attribution delays. Filter by campaign type and sort by total spend.
- Identify winners and losers across the entire account. Campaigns converting below the target ACoS threshold are winners. Those burning cash above target are losers.
- Calculate per-campaign ACoS individually. Compare SP, SB, and SD performance separately. A blended account-level ACoS hides unprofitable campaigns behind a few strong performers.
- Shift 10-15% of daily budget from underperformers to winners. Don’t make dramatic cuts. Gradual shifts preserve the algorithm’s learning data. Amazon’s algorithm needs 7-14 days to stabilize after budget changes.
- Test 10% incremental increases on winning campaigns. If a campaign hits target ACoS at $50/day, test $55/day for two weeks before scaling further. Effective Amazon PPC optimization relies on these measurable iterations.
Most sellers benefit from running this rebalancing routine monthly. During Q4 or seasonal peaks, switching to biweekly prevents missing surges in buyer search volume. Running a full Amazon PPC audit quarterly provides a deeper diagnostic baseline beyond monthly rebalancing.
Frequently Asked Questions About Amazon Advertising Budget
These are the most common questions sellers ask about PPC budget allocation and campaign spend strategy.
How much should I spend on Amazon ads as a new seller?
Start with $500 to $1,500 per month (or $15 to $50 per day) and allocate 80% to Sponsored Products. New sellers need keyword-driven discovery before investing in brand awareness campaigns.
What is the best budget split for Amazon PPC campaigns?
The 60/30/10 split across SP, SB, and SD works as a starting point. The product lifecycle stage and keyword performance data should determine the actual allocation for each product.
How often should I reallocate my Amazon ad budget?
Review allocation monthly. During Q4 or seasonal peaks, switch to biweekly reviews. Avoid changing budgets more often than every 7-14 days to let Amazon’s algorithm stabilize.
Should beginners use all three Amazon campaign types?
No. Start with Sponsored Products only for the first 30-60 days. Add Sponsored Brands once the product generates branded searches. Add Sponsored Display after building a remarketing audience of at least 1,000 impressions.
What percentage of Amazon revenue should go to advertising?
Target 10-20% of total revenue as TACoS (Total Advertising Cost of Sale). New products may run 20-30% TACoS during launch. Mature products should aim for 8-12%.
Which Amazon campaign type gives the best ROAS?
Sponsored Products typically delivers the highest ROAS at 3.5-6.5x because it targets shoppers actively searching with purchase intent. Sponsored Brands and Sponsored Display serve different strategic purposes: brand awareness and retargeting respectively.
Conclusion
Smart ad budget allocation separates profitable sellers from those burning cash on autopilot. The frameworks and data covered here distill into a few core takeaways:
- Allocation drives ROAS more than total spend. A focused $3,000 monthly budget outperforms a scattered $10,000 one.
- Lifecycle stage sets the template. Launch products need SP concentration; mature products need SB defense.
- Keyword data steers the adjustments. Search term reports and per-campaign ACoS provide the empirical basis for every budget shift.
- Monthly rebalancing turns a static budget into a growth engine. Five steps, once a month, keep capital flowing to the campaigns that convert.
Pull the last 30 days of search term data and calculate ACoS by campaign type. That single metric tells exactly where the ad budget should shift this month. For a complete campaign diagnostic, start with an Amazon PPC audit to establish the baseline.