
📑 Table of Contents
- What Are the Average Amazon CPC Benchmarks by Ad Type in 2026?
- How Much Does Amazon CPC Vary by Product Category?
- Why Do Some Amazon Categories Have 3x Higher CPCs Than Others?
- How Do Head Term vs Long-Tail Amazon CPCs Compare?
- When Do Amazon CPCs Spike During the Year?
- How Can Sellers Use CPC Benchmarks to Diagnose Keyword Problems?
- Frequently Asked Questions About Amazon CPC Benchmarks
- Conclusion
TL;DR
- CPCs are climbing fast: Average Amazon CPCs increased 35% between 2023 and early 2026 to reach $1.21 across all ad types.
- Sponsored Products baseline: SP averages $0.85 to $1.30 per click, while Sponsored Brands command $1.10 to $2.50.
- Category gaps are huge: CPCs range from $0.45 in Books to over $2.00 in Beauty and Supplements.
- ASP drives tolerance: High average selling price and heavy brand saturation push category CPCs higher.
- Long-tail wins: Head terms cost three to five times more than targeted long-tail keywords in the same category.
- Keyword selection is the lever: Shifting budget toward long-tail keywords is the most reliable strategy to reduce CPC without sacrificing sales volume.
- Seasonal spikes hit hard: Prime Day and Q4 drive seasonal CPC spikes of 10% to 30%, especially in gifting categories like Toys and Electronics.
Amazon CPCs climbed from $0.89 in 2023 to $1.21 in early 2026, marking a 35% increase in just three years. Most sellers have no reliable way to know if their cost per click is competitive or wasteful for their specific product category.
The rising costs steadily eat into profit margins, leaving brands guessing about standard advertising expenses. This article provides detailed amazon cpc benchmarks for 15 product categories, breaking down costs for Sponsored Products, Sponsored Brands, and Sponsored Display while establishing target ACoS ranges. It also shows how keyword selection acts as the primary lever for controlling CPC within any category.
What Are the Average Amazon CPC Benchmarks by Ad Type in 2026?
Average Amazon Sponsored Products CPC ranges from $0.85 to $1.30 in 2026, while Sponsored Brands run $1.10 to $2.50 and Sponsored Display $0.80 to $1.60.
Understanding these baseline averages helps sellers establish realistic expectations before diving into specific niches.
Ad Type |
Avg CPC Range |
Best For |
Billing Model |
|---|---|---|---|
Sponsored Products (SP) |
$0.85 – $1.30 |
Direct conversions, ASIN targeting |
Cost-Per-Click (CPC) |
Sponsored Brands (SB) |
$1.10 – $2.50 |
Brand awareness, higher funnel traffic |
Cost-Per-Click (CPC) |
Sponsored Display (SD) |
$0.80 – $1.60 |
Retargeting, cross-selling |
Cost-Per-Click (CPC) / vCPM |
Demand Side Platform (DSP) |
$5.65 (avg CPM) |
Audience building, off-Amazon reach |
Cost-Per-Mille (CPM) |
Sponsored Brands carry a premium price tag for specific reasons. These ads capture shoppers at the top of the buying funnel with large placements above search results. Video formats within Sponsored Brands also drive higher engagement than static product images, and Amazon prices this premium visibility accordingly.
Setting a proper advertising budget requires accounting for these differing ad format costs. Mixing Sponsored Products with Sponsored Brands will naturally raise an overall average CPC.
These ad type averages only tell part of the story, though. A $1.10 CPC might be a bargain in Beauty but represent overspending in Books.
How Much Does Amazon CPC Vary by Product Category?
Amazon CPCs vary by category from $0.45 in Books to over $2.00 in Beauty and Supplements, making category-specific benchmarks essential for budget decisions.
The sheer variance in click costs makes broad averages nearly useless for daily campaign management. Sellers need to evaluate bids against direct competitors selling similar items.
Category |
Avg CPC (SP) |
Avg CPC (SB) |
Target ACoS Range |
Competition Tier |
|---|---|---|---|---|
Electronics |
$1.00 – $1.40 |
$1.50 – $2.80 |
15% – 25% |
High |
Health & Personal Care |
$1.10 – $1.70 |
$1.60 – $3.00 |
18% – 28% |
High |
Beauty & Skincare |
$1.50 – $2.20 |
$2.00 – $3.50 |
20% – 30% |
High |
Home & Kitchen |
$0.80 – $1.20 |
$1.20 – $2.20 |
15% – 25% |
Medium |
Supplements |
$1.40 – $2.10 |
$1.80 – $3.20 |
20% – 35% |
High |
Grocery & Gourmet |
$0.50 – $0.90 |
$0.80 – $1.60 |
12% – 22% |
Medium |
Pet Supplies |
$0.90 – $1.40 |
$1.30 – $2.40 |
18% – 28% |
Medium-High |
Baby |
$0.85 – $1.30 |
$1.20 – $2.30 |
18% – 28% |
Medium |
Clothing & Accessories |
$0.70 – $1.10 |
$1.00 – $2.00 |
15% – 25% |
Medium |
Toys & Games |
$0.60 – $1.00 |
$0.90 – $1.80 |
12% – 22% |
Medium |
Sports & Outdoors |
$0.75 – $1.15 |
$1.10 – $2.10 |
15% – 25% |
Medium |
Tools & Home Improvement |
$0.80 – $1.25 |
$1.10 – $2.20 |
15% – 22% |
Medium |
Office Products |
$0.55 – $0.85 |
$0.80 – $1.50 |
12% – 20% |
Low-Medium |
Books |
$0.35 – $0.55 |
$0.50 – $1.00 |
10% – 18% |
Low |
Automotive |
$0.70 – $1.10 |
$1.00 – $2.00 |
15% – 25% |
Medium |
Reading this table comes down to understanding the spread within each range. Sellers hitting the lower end of their category’s amazon cpc benchmarks are typically running optimized campaigns focused on specific, low-competition search terms. Sellers clustered at the top of the range are targeting broad head terms to secure high search volume. The target ACoS directly correlates with these costs. A high CPC requires either a strong conversion rate or a high retail price to maintain profitability.
Tracking total advertising cost of sales, or TACoS, gives the full picture of how these click costs impact broader business health. A $2.00 click in Supplements might feel painful, but it remains sustainable if organic sales supplement the paid traffic.
The question isn’t just what category a seller operates in. The real question is why some categories cost so much more.
Why Do Some Amazon Categories Have 3x Higher CPCs Than Others?
Category CPC differences are driven by four factors: competition density, average selling price, conversion rate norms, and brand saturation in advertising.
Market forces shape every click cost on Amazon. The platform uses a second-price auction system, meaning sellers only pay one cent more than the next highest bidder.
Competition density inflates bid costs directly. More sellers fighting for the same search terms drive up the required bid to win top placement. Beauty currently features roughly four times more active advertisers per keyword than Books, according to Marketplace Pulse analysis. Tools that evaluate keyword difficulty help sellers navigate around these dense clusters of competitors.
Average selling price (ASP) dictates how much a seller can afford to pay per click. Higher-priced products absorb higher CPCs while remaining profitable. A $60 supplement brand can bid $2.00, convert at 10%, and still hit a healthy 33% ACoS. A $12 paperback brand simply cannot afford a $2.00 click under any scenario.
Conversion rate norms vary between product types and influence bidding behavior. Categories with lower baseline conversion rates require more clicks to generate a single sale, making each click more expensive to recoup. Electronics typically converts at 8% to 10%, while Grocery items often convert at 15% to 20%.
Brand saturation creates pricing floors in high-value categories. Large corporations dominate spaces like Electronics and Beauty with deep ad budgets, pushing CPCs up for every other seller in the category.
But here’s what most sellers miss: within any category, keyword selection matters more than bid strategy.
How Do Head Term vs Long-Tail Amazon CPCs Compare?
Head terms typically cost 3-5x more per click than long-tail alternatives in the same category, while long-tail keywords often convert at higher rates.
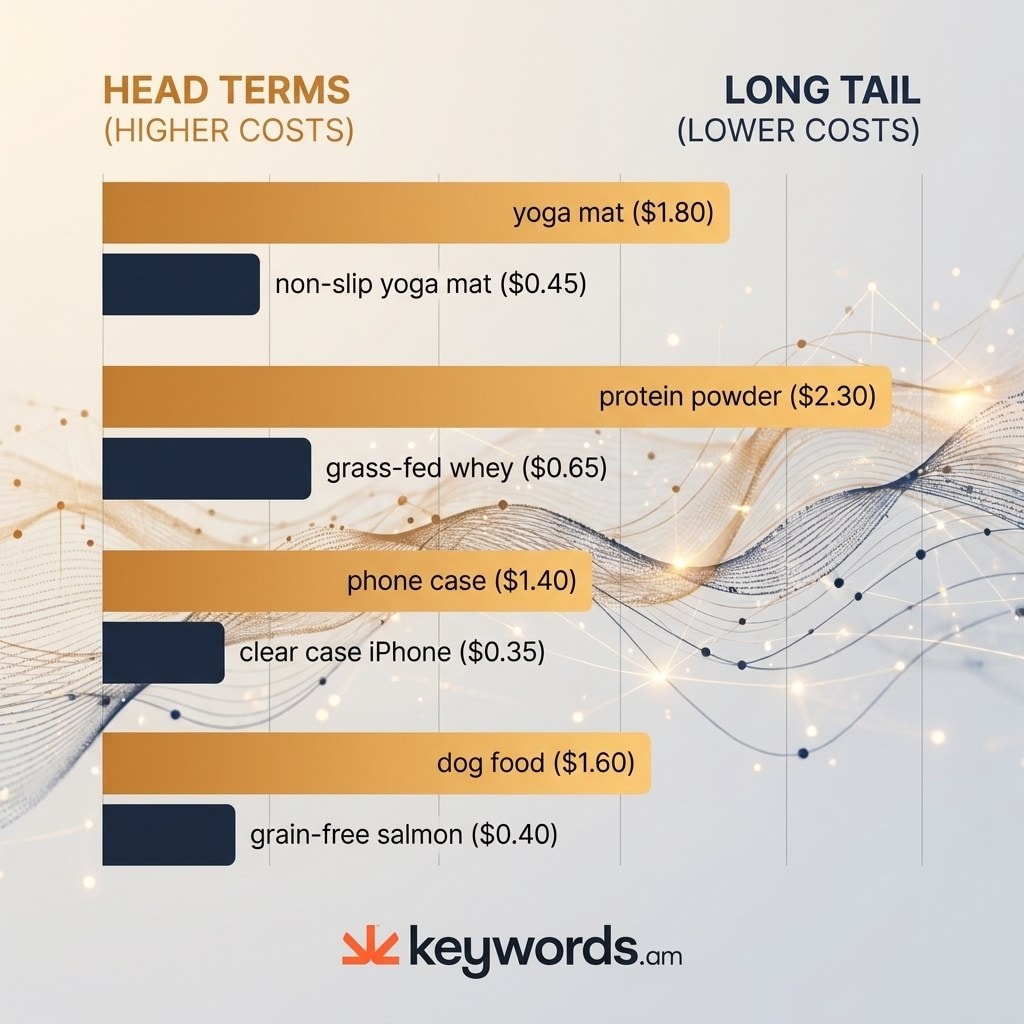
Keyword strategy determines the true cost structure of any campaign. Most sellers fixate on managing bids for competitive phrases, ignoring the cost gap built into the search terms themselves.
Head Term (High CPC) |
Long-Tail Equivalent (Low CPC) |
Cost Multiple |
|---|---|---|
“yoga mat” ($1.80) |
“non-slip yoga mat for hot yoga 6mm” ($0.45) |
4x |
“protein powder” ($2.30) |
“grass-fed whey protein isolate chocolate 5lb” ($0.65) |
3.5x |
“phone case” ($1.40) |
“iphone 15 pro max clear case magsafe” ($0.35) |
4x |
“dog food” ($1.60) |
“grain-free salmon dog food small breed senior” ($0.40) |
4x |
Long-tail queries cost less because fewer advertisers bid on them. A broad phrase like “yoga mat” triggers ads from every fitness brand on Amazon. A specific phrase like “non-slip yoga mat for hot yoga 6mm” only triggers ads from a small subset of relevant sellers.
Specific search phrases also indicate a buyer who’s ready to purchase. Someone searching for “protein powder” is browsing options. Someone searching for “grass-fed whey protein isolate chocolate 5lb” knows what they want and converts at a higher rate because the product matches their specific need.
Focusing on long-tail keywords is the most effective method for lowering CPCs within a category. Sellers who build campaigns around specific, descriptive queries start with structurally lower costs. Platforms like Keywords.am help uncover these low-competition phrases through reverse ASIN lookups and keyword difficulty scoring.
Refining a PPC keyword strategy around specific buyer intent removes the need to fight against enterprise-level budgets on broad terms.
Keyword selection sets the baseline, but timing also plays a role in how much each click costs.
When Do Amazon CPCs Spike During the Year?
Amazon CPCs spike 10-15% during Prime Day and Black Friday, with Q4 holiday season driving 20-30% increases in gifting categories like Toys and Electronics.
Advertising costs fluctuate predictably throughout the calendar year. Sellers who fail to anticipate these shifts often blow through monthly budgets in days during high-traffic events.
The seasonal pattern follows consumer spending habits closely:
- Q1 (Jan-Mar): CPCs dip post-holiday as advertisers pull back budgets. This is often the cheapest quarter for acquiring clicks.
- Q2 (Apr-Jun): Costs climb steadily toward summer sales events. Prime Day itself sees a roughly 10% CPC spike across the board.
- Q3 (Jul-Sep): Markets normalize after Prime Day, then begin a gradual buildup toward the winter holidays.
- Q4 (Oct-Dec): Black Friday triggers a 10% to 15% surge. The holiday season pushes gifting categories up 20% to 30%. February 2026 recorded a $1.21 average, representing the highest monthly average tracked to date.
Category-specific effects multiply these broader trends. Toys and Electronics face the steepest Q4 spikes as brands battle for holiday shoppers. Supplements see a sustained surge in January as consumers pursue New Year’s fitness resolutions.
Sellers can take advantage of these patterns by shifting their seasonal keyword strategy before spikes hit. Moving budget away from contested head terms and into specific long-tail queries right before Prime Day mitigates the worst pricing surges. Front-loading ad spend in Q1 allows brands to acquire cheaper customers and build organic ranking momentum while competitors are resting.
Understanding when CPCs spike is useful, but the real power of benchmarks is diagnosing why specific campaigns are over- or under-performing.
How Can Sellers Use CPC Benchmarks to Diagnose Keyword Problems?
Sellers can diagnose campaign problems by comparing their actual CPC, ACoS, and conversion rates against category benchmarks to identify keyword, bid, or listing issues.
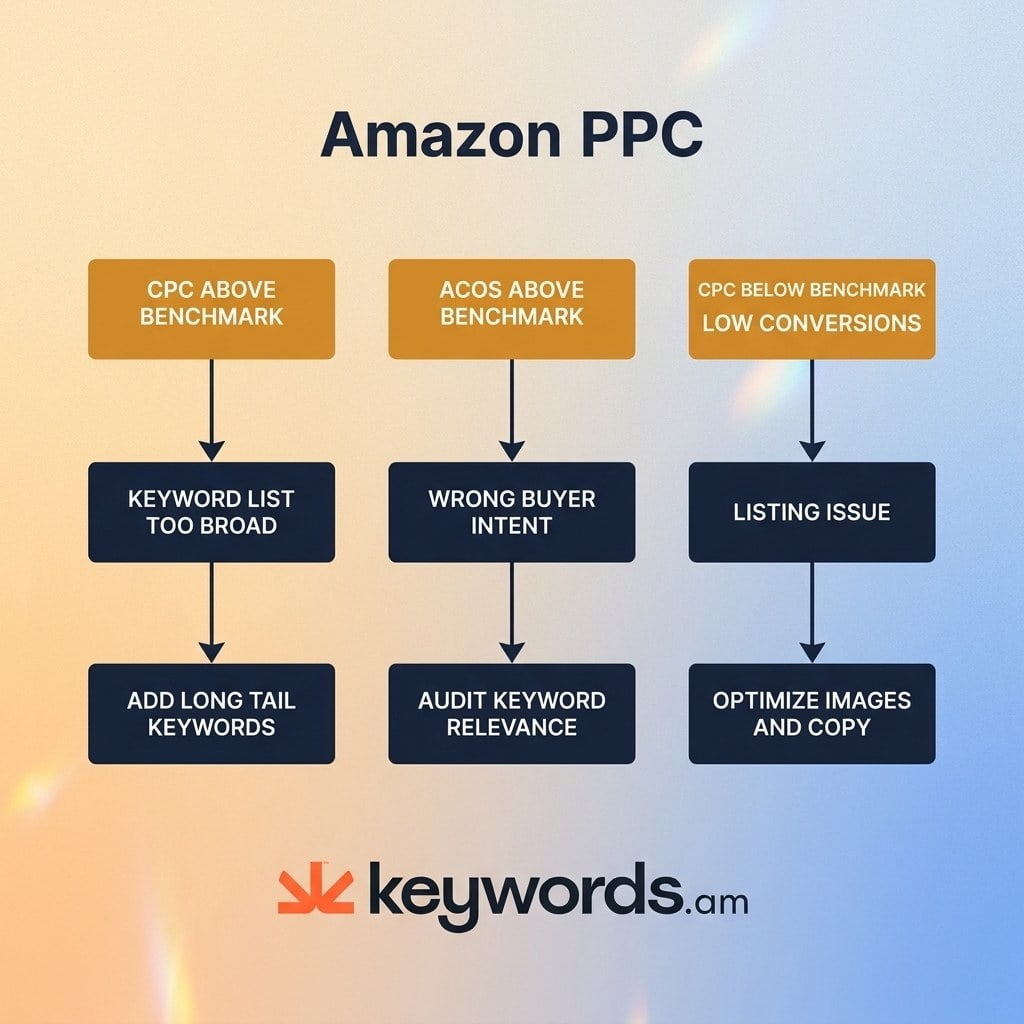
Benchmark data serves no purpose if sellers don’t apply it to their campaign structure. Category averages can pinpoint exactly where an advertising strategy is failing.
- CPC exceeds the category benchmark. The likely cause is a keyword list skewed toward broad head terms. The fix: pause expensive terms, add targeted long-tail phrases, and deploy negative keywords to eliminate wasted spend on irrelevant searches.
- ACoS exceeds the category benchmark. The likely cause is low keyword relevance, meaning campaigns target the wrong buyer intent. The fix: audit keyword-to-listing alignment. Effective PPC optimization depends on this tight alignment.
- CPC sits below benchmark but conversions stay low. The likely cause is an unoptimized product detail page that fails to convert the traffic it receives. The fix: improve main images, rewrite bullet points, and work on securing stronger customer reviews.
Running a systematic PPC audit with this diagnostic framework isolates problems quickly. Sellers stop guessing and start fixing the specific broken mechanism within their funnel. Keyword research tools with difficulty scoring, like those available through Keywords.am, address the first scenario directly by highlighting lower-competition alternatives before money gets wasted on expensive head terms.
Frequently Asked Questions About Amazon CPC Benchmarks
These are the most common questions sellers ask about CPC costs and Amazon advertising.
Conclusion
Amazon advertising costs continue to evolve, demanding a more strategic approach to budget management and keyword selection. The days of bidding high on broad terms and maintaining profitability are fading.
- Category context matters. Evaluating click costs against broad platform averages without category context leads to bad decisions.
- Keyword selection dictates costs. Choosing the right search terms has a bigger impact on CPC than bid management alone.
- Seasonal planning saves budget. Anticipating CPC spikes preserves budget for high-converting periods and prevents cost overruns.
The immediate next step: review current campaign CPCs against the category benchmark table above. If any campaign registers 20% above the stated benchmark, audit the keyword list for heavy reliance on expensive head terms. Pausing those broad terms and shifting budget to specific, descriptive queries will improve campaign efficiency and bring CPC costs back in line with category benchmarks.